-
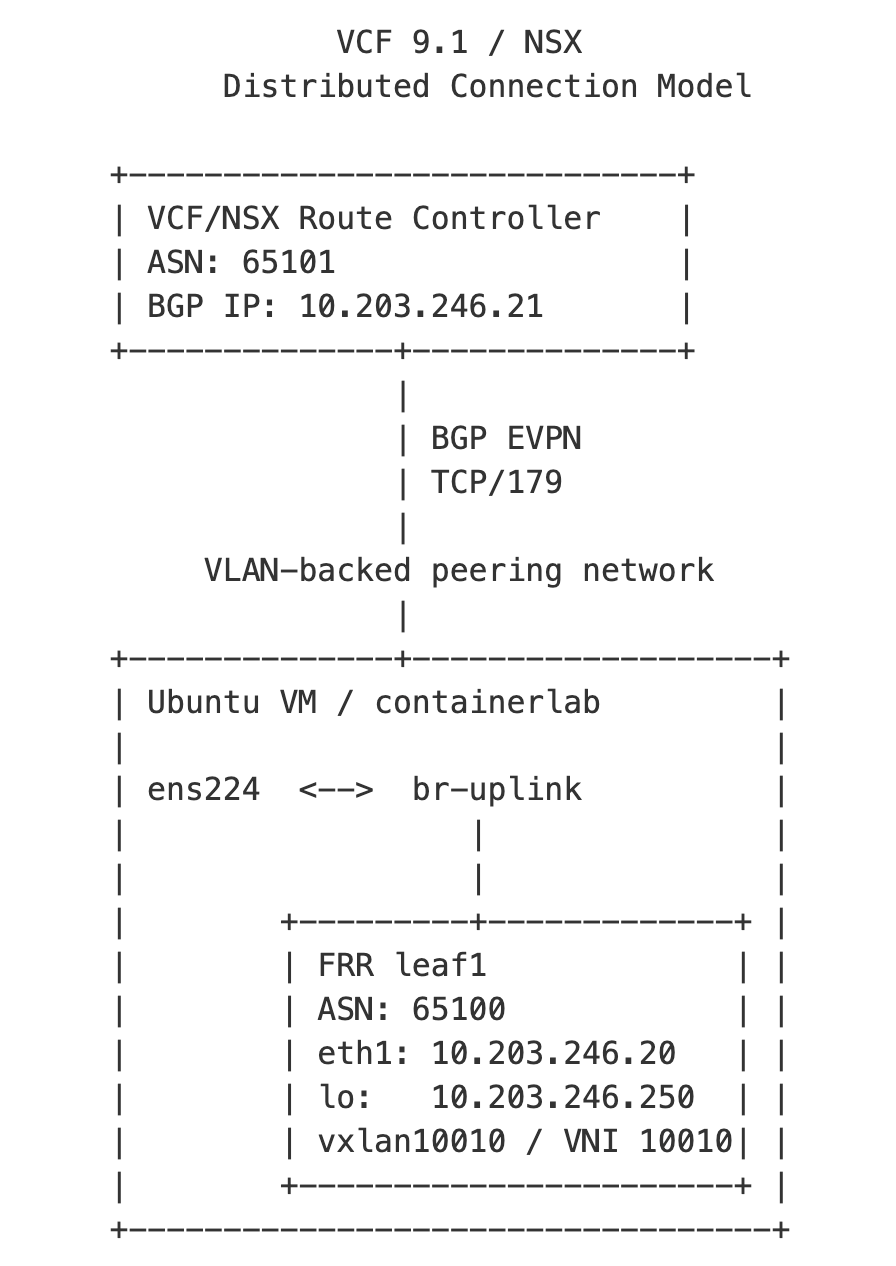
Testing the VCF 9.1 Distributed Connection Model with BGP EVPN and VXLAN
A small lab using containerlab and FRR to test the VCF 9.1 distributed connection model with BGP EVPN over VXLAN, focusing on Route Controller peering and control-plane visibility before testing against a physical EVPN fabric. Continue reading
-
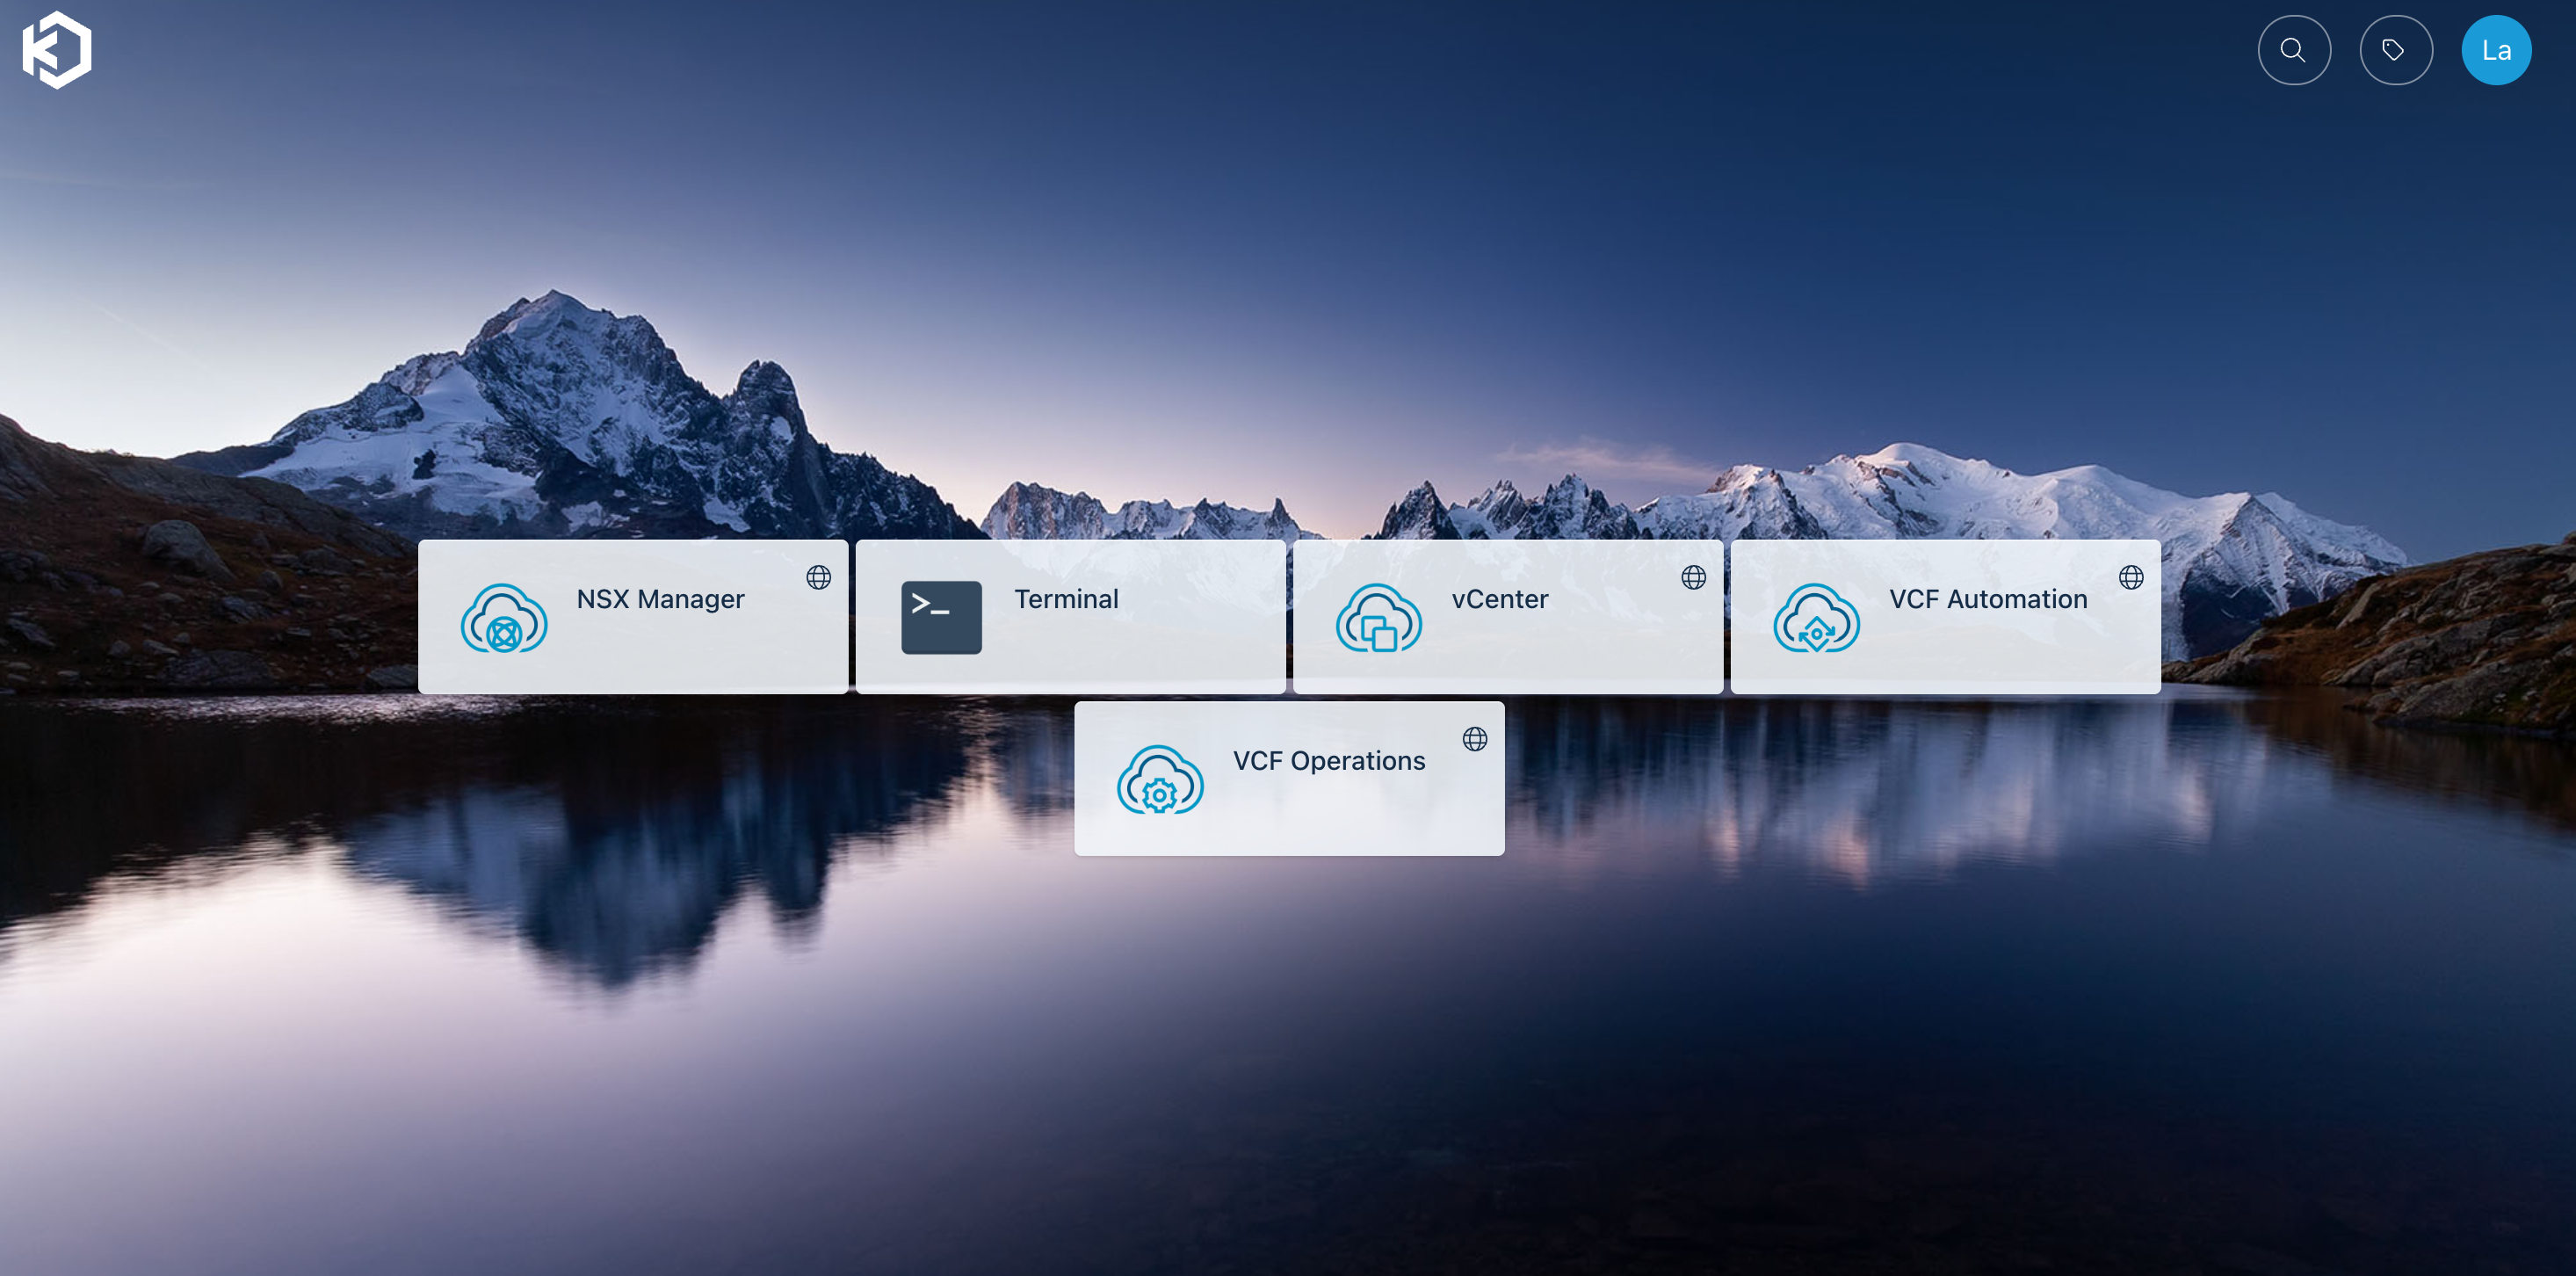
Using Kasm as a Browser-Based Jump Point for a VCF 9 Lab
Using Kasm as a browser-based access layer in front of a VCF lab turned out to be a useful pattern. With Keycloak providing authentication for both Kasm and VCF SSO, the lab gets a cleaner access flow without exposing every… Continue reading
-
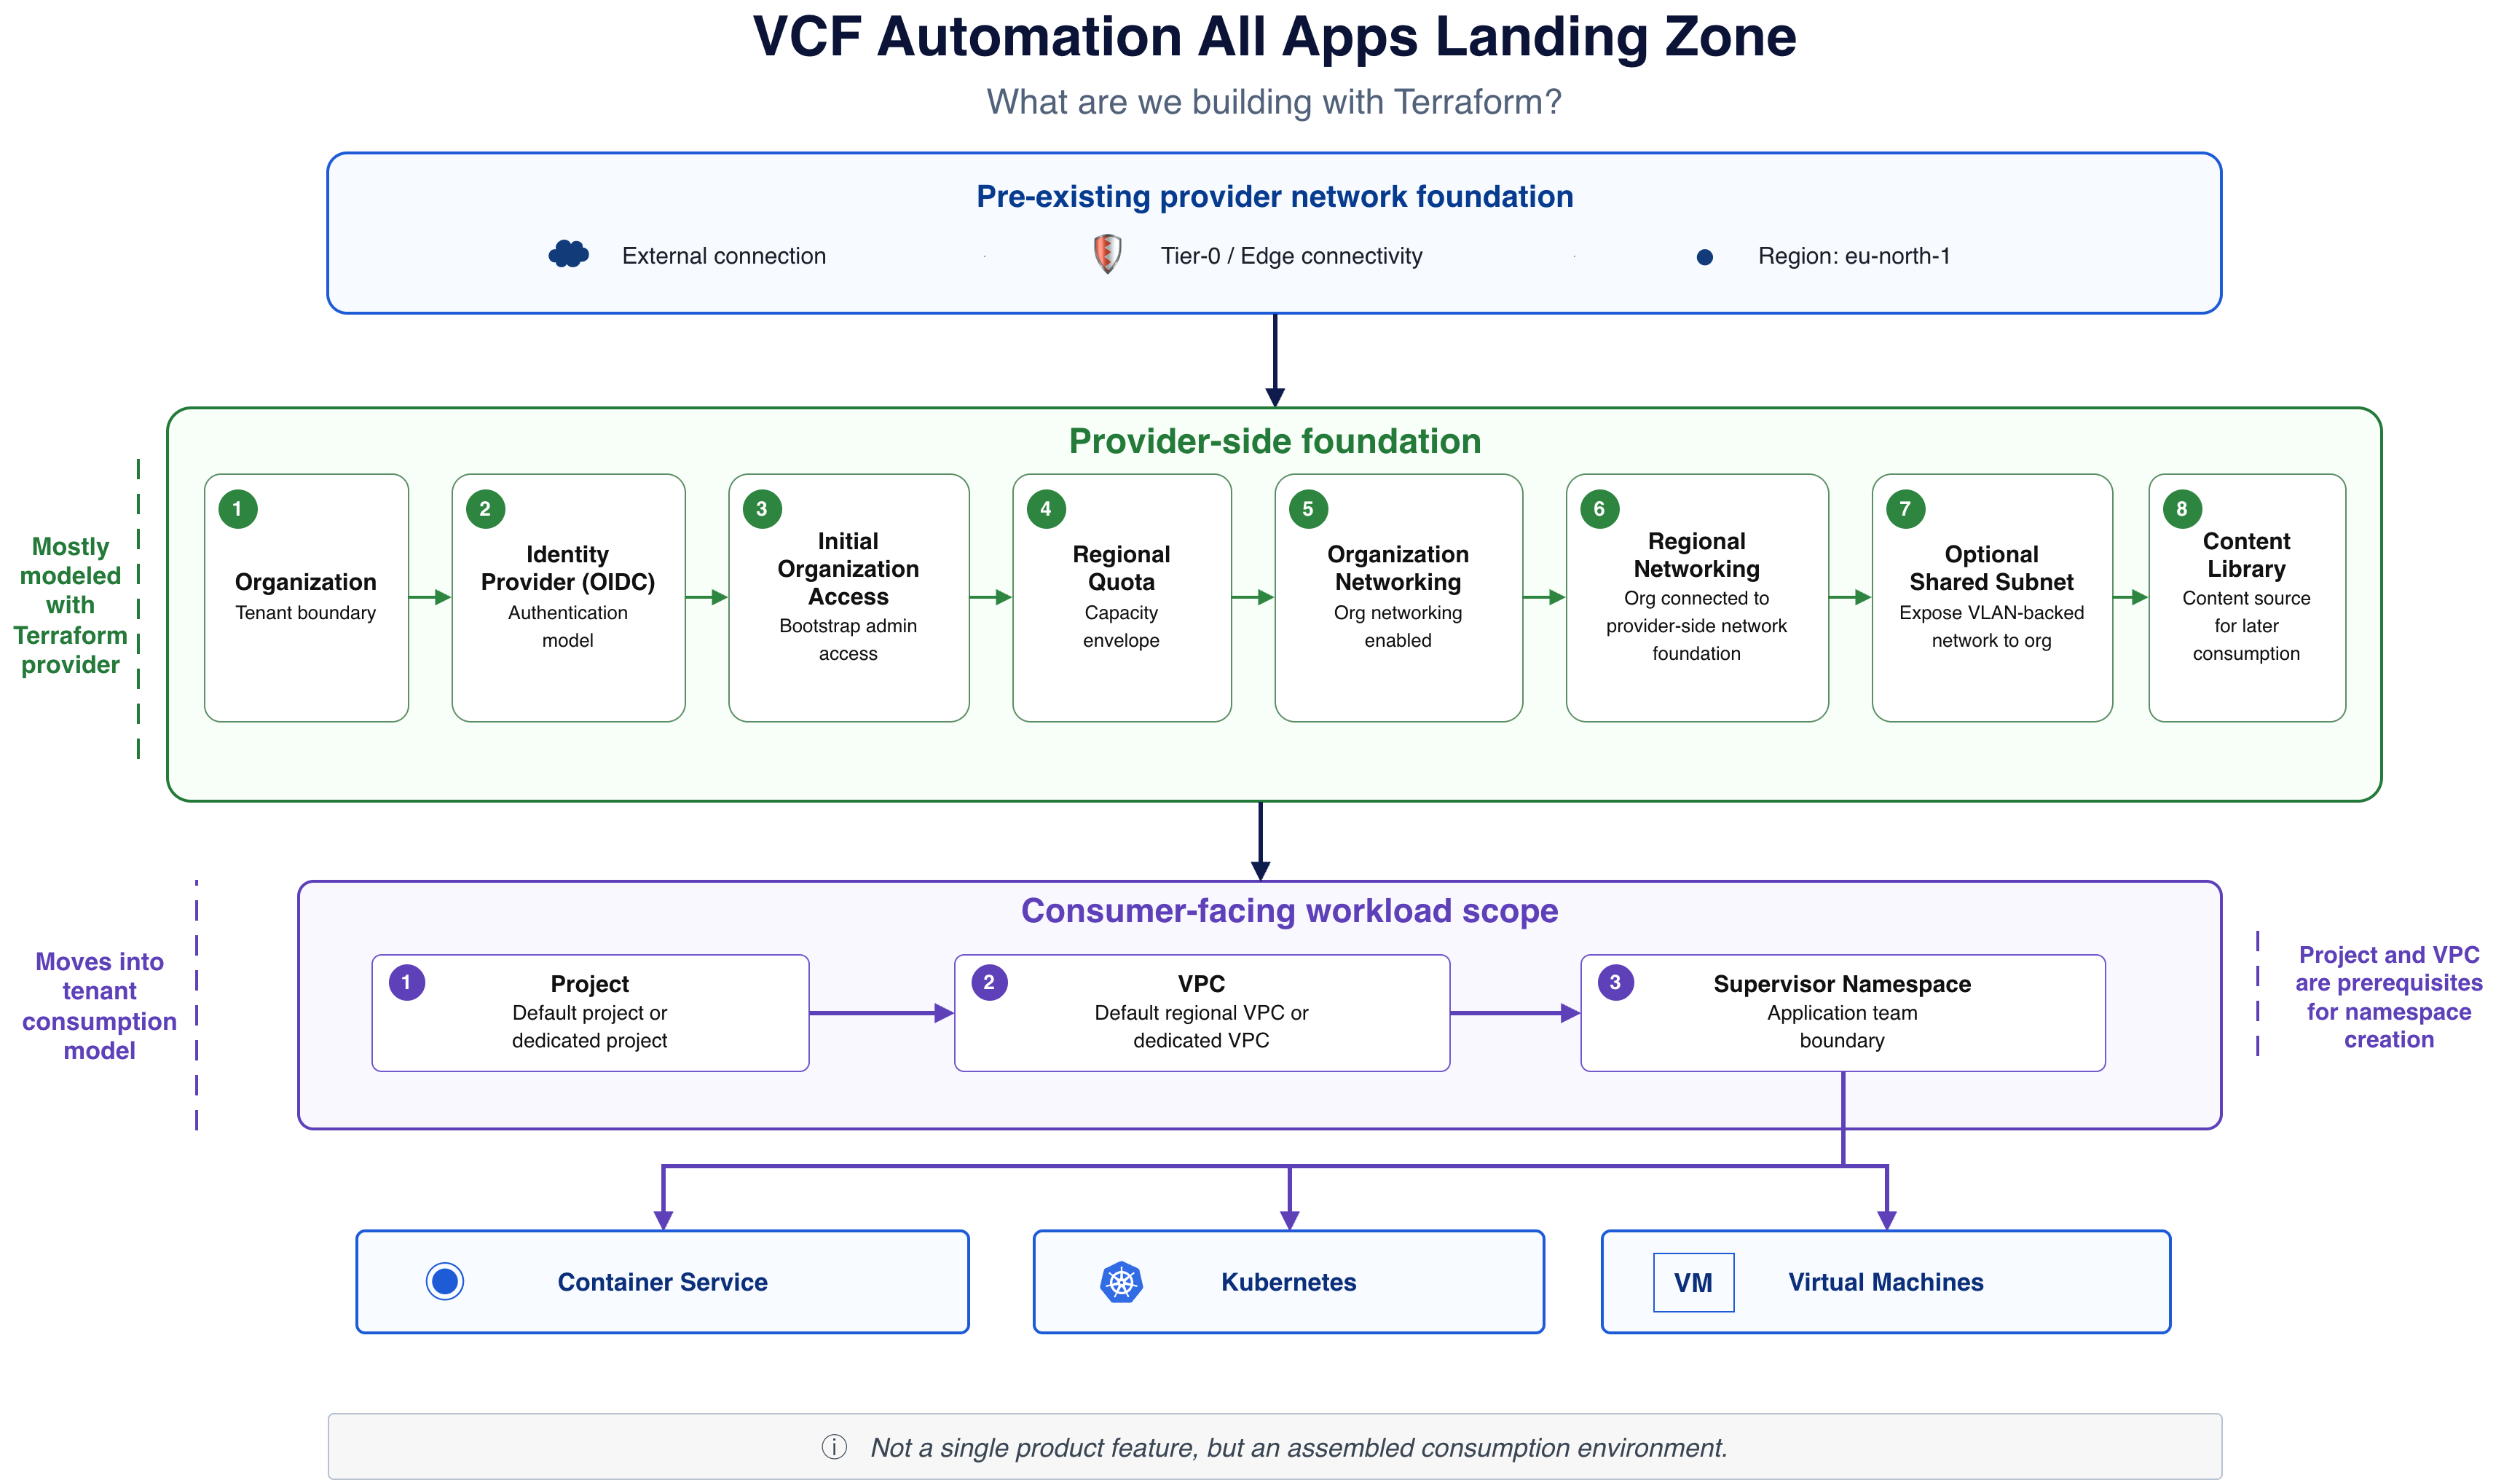
Building the Foundation for a VCF Automation All Apps Landing Zone with Terraform
Terraform can describe parts of a VCF Automation 9.1 All Apps landing zone, but not the full model end to end. In this post I walk through the first layers of the landing zone foundation, including organization creation, identity provider… Continue reading
-
Using Keycloak as an OIDC Identity Provider for a VCF Automation Organization
I wanted to test organization-level OIDC authentication in VCF Automation 9.1 using Keycloak from my Provider Box setup. It worked in the end, but a few small details around group claims and claims mapping were easy to miss. Continue reading
-
Guardrails in VCF Automation 9.1
Self-service without guardrails is just delegated infrastructure access with a nicer interface. In this post I look at guardrails in the VCF Automation 9.1 All Apps model, and how organizations, quotas, namespaces, networking, policies, and extensibility work together to make… Continue reading
-
Owning the Platform on VCF 9
In my previous article, I reflected on what I would design differently if I were building an NSX platform today. That piece focused on architectural choices — fewer abstractions, clearer boundaries, stronger defaults. But design decisions are only part of… Continue reading
-
Avi Load Balancer Metrics with Prometheus and Grafana
Avi Load Balancer offers a wealth of valuable metrics that can be accessed directly via the Avi Controller’s UI or API. However, there are various reasons why you might want to make these metrics available outside of its native platform.… Continue reading

-
Network Visibility for TKG Service Clusters
TKG Service Clusters using the default Antrea CNI, can be easily configured for enhanced network visibility through flow visualization and monitoring. The ability to monitor network traffic within your Kubernetes clusters, as well as between your Kubernetes constructs and the… Continue reading

-
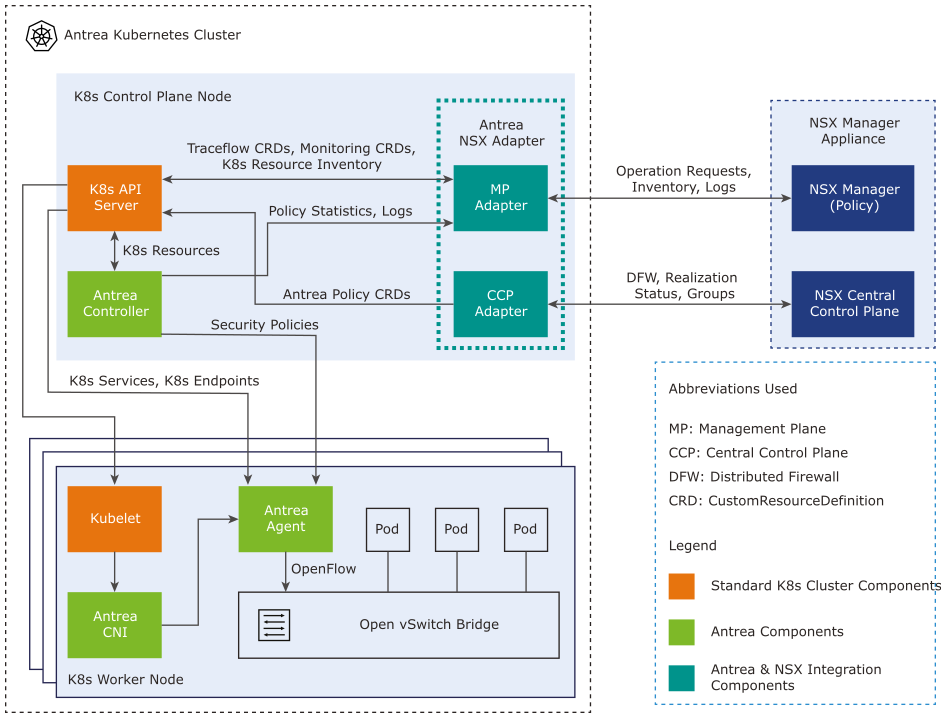
Integrating TKG Service Clusters with NSX Security
Organizations aiming to leverage NSX for securing their TKG Service Clusters (Kubernetes clusters) can now achieve this with relative ease. In this guide, I’ll walk you through configuring the integration between a TKG Service Cluster and NSX—a required step for… Continue reading